Who will win the Premier League title this season? While Leicester City and Tottenham Hotspur have their merits, the bookmakers and public analytics models point to a two-horse race between Manchester City and Arsenal.
From an analytics perspective, this is where things get interesting, as depending on your metric of choice, the picture painted of each team is quite different.
As discussed on the recent StatsBomb podcast, Manchester City are heavily favoured by ‘traditional’ shot metrics, as well as by combined team ratings composed of multiple shooting statistics (a method pioneered by James Grayson). Of particular concern for Arsenal are their poor shot-on-target numbers.
However, if we look at expected goals based on all shots taken and conceded, then Arsenal lead the way: Michael Caley has them with an expected goal difference per game of 0.98, while City lie second on 0.83. My own figures in open-play have Arsenal ahead but by a narrower margin (0.69 vs 0.65); Arsenal have a significant edge in terms of ‘big chances’, which I don’t include in my model, whereas Michael does include them. Turning to my non-shots based expected goal model, Arsenal’s edge is extended (0.66 vs 0.53). Finally, Paul Riley’s expected goal model favours City over Arsenal (0.88 vs 0.69), although Spurs are actually rated higher than both. Paul’s model considers shots on target only, which largely explains the contrast with other expected goal models.
Overall, City are rated quite strongly across the board, while Arsenal’s level is more mixed. The above isn’t an exhaustive list of models and metrics but the differences between how they rate the two main title contenders is apparent. All of these metrics have demonstrated utility at making in-season predictions but clearly assumptions about the relative strength of these two teams differs between them.
The question is why? If we look at the two extremes in terms of these methods, you would have total shots difference (or ratio, TSR) at one end and non-shots expected goals at the other i.e. one values all shots equally, while the other doesn’t ‘care’ whether a shot is taken or not.
There likely exists a range of happy mediums in terms of emphasising the taking of shots versus maximising the likelihood of scoring from a given attack. Such a trade-off likely depends on individual players in a team, tactical setup and a whole other host of factors including the current score line and incentives during a match.
However, a team could be accused of shooting too readily, which might mean spurning a better scoring opportunity in favour of a shot from long-range. Perhaps data can pick out those ‘trigger-happy’ teams versus those who adopt a more patient approach.
My non-shots based expected goal model evaluates the likelihood of a goal being scored from an individual chain of possession. If I switch goals for shots in the maths, then I can calculate the probability that a possession will end with a shot. We’ll refer to this as ‘expected shots’.
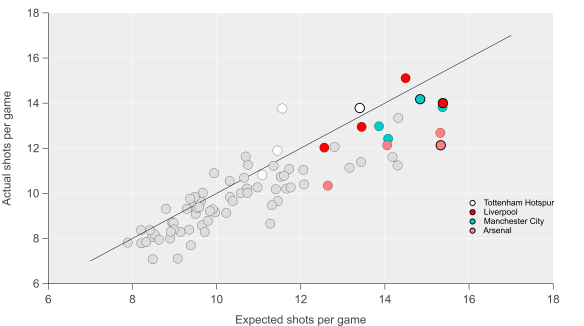
I’ve done this for the 2012/13 to 2014/15 Premier League seasons. Below is the data for the actual versus expected number of shots per game that each team attempted.

Actual shots per game compared with expected shots per game. Black line is the 1:1 line. Data via Opta.
We can see that the model does a reasonable job of capturing shot expectation (r-squared is at 0.77, while the mean absolute error is 0.91 shots per game). There is some bias in the relationship though, with lower shot volume teams being estimated more accurately, while higher shot volume sides typically shoot less than expected (the slope of the linear regression line is 0.79).
If we take the model at face value and assume that it is telling a reasonable approximation of the truth, then one interpretation would be that teams with higher expected shot volumes are more patient in their approach. Historically these have been teams that tend to dominate territory and possession such as Manchester City, Arsenal and Chelsea; are these teams maintaining possession in the final third in order to take a higher value shot? It could also be due to defenses denying these teams shooting opportunities but looking at the figures for expected and actual shots conceded, the data doesn’t support that notion.
What is also clear from the graph is that it appears to match our expectations in terms of a team being ‘trigger-happy’ – by far the largest outlier in terms of actual shots minus expected shots is Tottenham Hotspurs’ full season under André Villas-Boas, a team that was well known for taking a lot of shots from long-range. We also see a decline as we move into the 2013/14 season when AVB was fired after 16 matches (42% of the full season) and then the 2014/15 season under Pochettino. Observations such as these that pass the ‘sniff-test’ can give us a little more confidence in the metric/method.
If we move back to the season at hand, then we see some interesting trends emerge. Below I’ve added the data points for this current season and highlighted Arsenal, Manchester City, Liverpool and Tottenham (the solid black outlines are for this season). Throughout the dataset, we see that Arsenal have been consistently below expectations in terms of the number of shots they attempt and that this is particularly true this season. City have also fallen below expectations but to a smaller extent than Arsenal and are almost in line with expectations this year. Liverpool and Tottenham have taken a similar number of shots but with quite different levels of expectation.

Actual shots per game compared with expected shots per game. Black line is the 1:1 line. Markers with solid black outline are for the current season. Data via Opta.
None of the above indicates that there is a better way of attempting to score but I think it does illustrate that team style and tactics are important factors in how we build and assess metrics. Arsenal’s ‘pass it in the net’ approach has been known (and often derided) ever since they last won the league and it is quite possible that models that are more focused on quality in possession will over-rate their chances in the same way that focusing on just shots would over-rate AVB’s Spurs. Manchester City have run the best attack in the league over the past few seasons by combining the intricate passing skills of their attackers with the odd thunder-bastard from Yaya Touré.
The question remains though: who will win the Premier League title this season? Will Manchester City prevail due to their mixed-approach or will Arsenal prove that patience really is a virtue? The boring answer is that time will tell. The obvious answer is Leicester City.


