Originally published on StatsBomb.
Leicester City’s rise to the top of the Premier League has led to many an analysis by now. Reasons for their ascent have mainly focused on smart recruitment and their counter-attacking style of play, as well as a healthy dose of luck. While their underlying defensive numbers leave something to be desired, their attack is genuinely good. The pace and directness of their attack has regularly been identified as a key facet of their style by writers with analytical leanings.
Analysis by Daniel Altman has been cited in both the Economist and the Guardian, with the crux being that the ‘key’ to stopping Leicester is to ‘slow them down’. Using slightly different metrics, David Sumpter illustrated this further at the recent Opta Pro Forum and on the Sky Sports website, where his analysis surmised that:
For Leicester, it’s about the speed of the attack.
An obvious and somewhat unaddressed question here is whether the pace of Leicester’s attack is the key to their increased effectiveness this season? Equating style with success in football is often a fraught exercise; the often tedious and pale imitations of Guardiola’s possession-orientated approach being a recent example across football.
Below are a raft of numbers comparing various facets of Leicester’s style and effectiveness this season with last season.
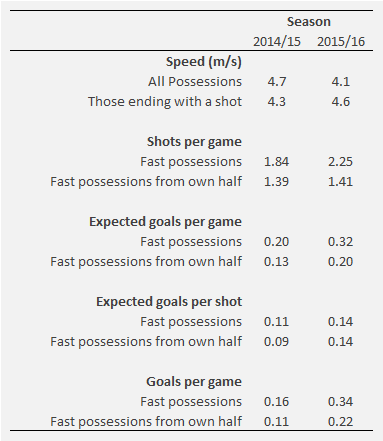
Comparison between Leicester City’s speed of attack and shot profile from ‘fast’ possessions. A possession is a passage of play where a team maintains unbroken control of the ball. Possessions moving at greater than 5 m/s on average are classed as ‘fast’. All values are for open-play possessions only. Data via Opta.
The take home message here is that the average pace of Leicester’s play has barely shifted this season compared to last. Only Burnley in 2014/15 and Aston Villa in 2013/14 have attacked at a greater pace than Leicester this season over the past four years.
The proportion of their shots generated via fast paced possessions has risen this year (from 27.5% to 32.1%) and Leicester currently occupy the top position by this metric over this period. In terms of counter-attacking situations, their numbers have barely changed this season (20.1%) compared to last season (20.8%), with only the aforementioned Aston Villa having a greater proportion (21.3%) than them in my dataset.
What has altered is the effectiveness of their attacks this season, as we can see that their expected goal figures have risen. Below are charts comparing their shots from counter-attacking situations, where we can see more shots in the central zone of the penalty area this season and several better quality chances.

Comparison of Leicester City’s shots from ‘fast’ and ‘deep’ attacks in 2014/15 and 2015/16. Points are coloured by their expected goal value (red = higher xG, lighter = lower xG). Any resemblance to the MK Shot Maps is entirely intentional. Data via Opta.
Their improvement this year sees them currently rank first and second in expected goals per game from fast-attacks and counter-attacks respectively over the past four season (THAT Liverpool team rank second and first). Based on my figures, Leicester’s goals from these situations are closely in line with expectations also (N.B. my expected goal model doesn’t explicitly account for counter-attacking moves).
The figure below shows how this has evolved over the past two seasons, where we see fast-attacks helping drive their improved attack at the end of 2014/15, which continued into this season. There has been a gradual decline since an early-season peak, although their expected goals from fast-attacks has reduced more than their overall attacking output in open-play, indicating some compensation from other forms of attack.
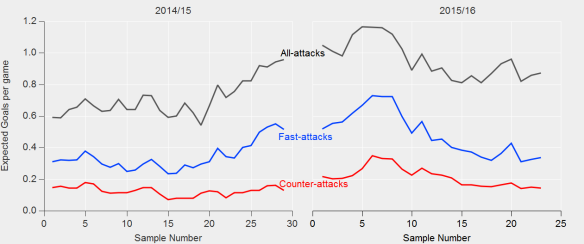
Rolling ten-match samples of Leicester City’s expected goals for in 2014/15 and 2015/16. All data is for open-play shots only. Data via Opta.
The effectiveness of these attacks has gone a long way to improving Leicester’s offensive numbers. According to my expected goal figures in open-play, they’ve improved from 0.70 per game to 0.94 per game this season. About half of that improvement has come from ‘fast’ paced possessions, with many of these possessions starting from deep areas in their own half.
Examining the way these chances are being created highlights that Leicester are completing more through-balls during their build-up play this season. The absolute numbers are small, with an increase from 11 to 17 through-balls during ‘fast’ possessions and from 6 to 12 during ‘fast’ possessions from their own half, but they do help to explain the increased effectiveness of their play. Approximately 27% of their shots from counter-attacks include a through-ball during their build-up this season, compared to just 11% last season. Through-balls are an effective means of opening up space and increasing the likelihood of scoring during these fast-paced moves. Leicester’s counter-attacks are also far less reliant on crosses this season, with just 2 of these attacks featuring a cross during build-up compared to 9 last season, which will further increase the likelihood of scoring.
Speed is an illusion. Leicester’s doubly so.
Overall, attacking at pace is a difficult skill to master but the rewards can be high. The pace and verve of Leicester’s attack has been eye-catching but it is the execution of these attacks, rather than the actual speed of them that has been the most important factor. Slowing Leicester down isn’t the key to stopping them, rather the focus should be either on denying them those potential counter-attacking situations or diluting their impact should you find yourself on the receiving end of one.
Whether they can sustain their attacking output from these situations is a difficult question to answer. If we examine how well output is maintained from one year to the next, the correlation for expected goals from counter-attacks is reasonable (0.55), while goal expectation per shot is lower (0.30). Many factors will determine the values here, not least the relatively small number of shots per season of this type, as well as a host of other intrinsic football factors. For fast-attacks, the correlations rise to 0.59 for expected goals and 0.52 for expected goals per shot. For comparison, the values for all open-play shots in my data-set are 0.91 and 0.63.
Examining the data in a little more depth suggests that the better counter-attacking and/or fast-paced teams tend to maintain their output, particularly if they retain managerial and squad continuity. Leicester have a good attack overall that is excellent at exploiting space with fast-attacking moves.
Retaining and perhaps even supplementing their attacking core over the summer would likely go a long way to maintaining a style of play that has brought them rich rewards.