Crossing efficiency: open-play vs set-play

In my previous post, I looked at how Liverpool seemingly focussed upon crossing last season and how it was on the whole unsuccessful, at least in open-play. One thing that I noted was that crossing from set-pieces appeared to be more successful in terms of goals scored than crosses in open-play.

The average number of crosses per goal scored last season was 79 in open-play and 28.3 from a set-piece. Crossing accuracy is also higher for set-pieces (33.9%) compared with open-play (20.5%). This demonstrates that crossing is more effective from set-pieces than in open play.

So the question is: Which teams were particularly efficient at scoring from set-play crosses and how did this contrast with their open-play performance?

Crossing efficiency

As with the crosses from open-play analysis, there are several under and over-performers in terms of crosses from set-pieces. Furthermore, some teams score a large proportion of their goals from crosses.
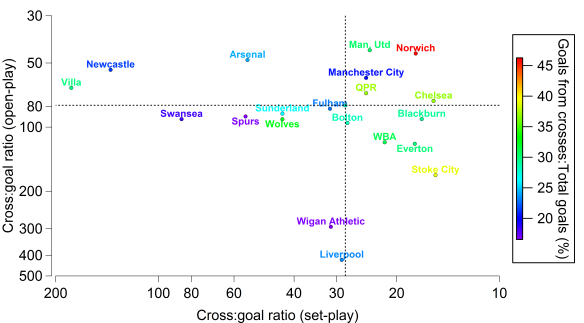
Relationship between the number of crosses in open-play required to score a goal from a cross in open-play and the number of crosses from a set-play required to score a goal from a cross at a set-play for English Premier League teams in 2011/12. Note that both scales are logarithmic and that they are reversed as a larger number is worse. The horizontal dashed black line indicates the average number of open-play crosses required to score a goal from a cross in open-play across the league, while the vertical dashed black line indicates the number of crosses from a set-play required to score a goal from a cross at a set-play. The teams are coloured by the percentage amount of goals they scored from all crosses, relative to their total number of goals. Data is provided by Opta and EPL-Index.

Stoke conformed to their stereotype here as they led the way marginally from Chelsea, as they required 15.4 crosses per goal at a set-piece compared to Chelsea’s 15.6. Chelsea scored 14 goals in total from set-pieces, while Stoke scored 10. Other notable performers were Blackburn (16.9), Norwich (17.6) and Everton (17.7). Norwich were probably the most efficient crossing team in the league last season, as they scored frequently compared to their peers from both open-play and set-pieces. In fact, 46% of their goals came from crosses last season, ahead of Stoke (39%), QPR (37%) and Chelsea (37%). Whether such numbers will be sustainable next season could be crucial for Norwich under Chris Hughton.

Aston Villa (180), Newcastle (138) and Swansea (85.5) were the clearest under-achievers, as they only scored 4 goals from a set-piece cross between them. In contrast to their severe under-performance in the open-play crossing analysis, Liverpool were about average as far as set-piece crosses were concerned. Indeed, Liverpool scored 9 goals from set-piece crosses last season, which was joint third with Blackburn, Everton and West Brom.

Getting to the byline

One of the aspects of crossing that I find curious is the poor success rate of crosses in terms of their accuracy. At first glance, the accuracy of crosses appears to be uniformly low; 23.4% for all crosses, with Arsenal posting the lowest (21.5%) and Norwich having the highest (27.3%). Accuracy is even worse in open-play, where it drops to 20.5% on average last season. Norwich are again the highest (24.8%), while Bolton had the lowest (17.2%). The overall crossing accuracy figures are skewed by the greater accuracy from set-piece crosses, which on average were accurate 33.9% of the time. Newcastle had the lowest accuracy with 23.9%, which was far lower than any other side (Liverpool were next lowest with 29.1%). Such a low accuracy goes some way to explaining their poor efficiency from set-piece crosses. The contrast to this is Aston Villa, who amazingly had the highest set-piece cross accuracy with 41.7% but could only score 1 goal from a set-piece cross all season.

This greater range and contrast in crossing accuracy when they are broken down potentially points towards a level of granularity in the crossing data, that is not separated by the coarse definition of crosses used here. Ideally, the crosses would be separated by the position from which the cross originated, along with defending and attacking players positioning. EPL-Index include “byline crosses” in their crossing database, which is a start as it shows that such crosses are far more accurate on average (47.8%). If we assume that successfully crossing to a team-mate is the first stage in potentially creating a chance to shoot and subsequently scoring, then it would appear that byline crosses are a far better option than other crosses in open-play; open-play crosses excluding these byline crosses have an accuracy of 19.7%.

Sadly I don’t have enough information available to assess whether byline crosses are a more efficient means of scoring from a cross plus the sample size is relatively small compared to total open-play crosses on a team-by-team basis. Some teams essentially never get to the byline and cross the ball; Stoke attempted only 2 byline crosses all season. Only Manchester City (50), Arsenal (47), Liverpool (34) and Manchester United (31) really attempted enough to draw even tentative conclusions. However, it would make sense if such crosses were a more effective means of scoring from a cross as they are often attempted closer to goal, which may result in an easier chance for the receiver.

In the mixer

Based on last season, set-piece crosses are a more efficient means of scoring than open-play crosses. There are likely a multitude of reasons for this, one of which is possibly the superior crossing accuracy from set-pieces compared to those in open-play. The greater parity in numbers between attackers and defenders could be another reason plus the more specialised headers of the ball, such as centre-backs, could be used to greater effect at set-pieces. One potential method of extracting more value from crosses is to attempt them closer to the byline, where the accuracy is far greater than other open-play crosses but at present I don’t have enough data to fully explore this idea.

Overall, scoring from a cross does not appear to be a particularly efficient and direct method of providing goals. However, it could be argued that a goal may indirectly result from a cross; the “in the mixer” approach, although this is likely to be particularly subject to the vagaries of luck and is more applicable to set-pieces. Based on last season, a team will on average score a goal from a cross in open-play every 79 crosses. Even the best performers in the league needed 45 crosses on average to score a single goal. The average number of open-play crosses per game attempted by a team last season was 17, which suggests that over the long-term, a team can expect to at best score a goal from an open-play cross every 2-3 games. Crossing, especially in open-play, appears to be a low-yield method of scoring.

If Liverpool had been merely average last season, the 841 open-play crosses they attempted would have yielded an extra 8 goals. If they had been exceptional, they could have expected another 16 goals. The question is whether this is a good enough return to motivate basing your playing style upon over the long-term?

Advertisement

A cross to bear: Liverpool’s crossing addiction in 2011/12

In some recent interviews, Simon Kuper has suggested that Liverpool established a data-driven style of play focussed around crossing last season. He theorised that Liverpool attempted to cater to Andy Carroll’s heading strengths by buying players with good crossing statistics, such as Stewart Downing and Jordan Henderson. Kuper then goes on to state that such an approach is flawed due to crossing being an inefficient means of scoring goals.

Earlier in the season, the Guardian’s Secret Footballer also suggested that statistical principles guided Damien Comolli towards a crossing focussed approach in the transfer market. Andrew Beasley conducted an excellent analysis for The Tomkins Times on whether the data indicated that such an approach (along with some others) was actually working.

So the question is: Did Liverpool really pursue a strategy based around crossing last season and to what extent was it successful (you can probably guess the answer to the second part)?

Noughts & Crosses

Firstly, Opta define a cross as:

A pass from a wide position into a specific area in front of the goal.

The basic numbers show that Liverpool attempted more crosses (1102) than any other team in the Premier League last season. Manchester United (1018) and Wolves (999) ranked second and third respectively. At the other end of the scale, Blackburn (610), Fulham (649) and Swansea (721) attempted the fewest. The average per team was 837.2 crosses attempted, which equates to just over 22 crosses per game.

While the raw numbers provide a guide, it is possible that the figures could be skewed by how much of the ball a particular team has on average. For example, Wolves had much less of the ball than Manchester United last season but attempted a similar number of crosses. This suggests that Wolves were keener to attempt crosses than Manchester United. Furthermore, set-plays should be isolated from the total crosses, as teams may have different approaches in open-play vs set-play. In order to account for this, I’ve calculated the ratio of attacking half passes to total open-play crosses in the graph below. This gives an indication of how keen a team is to attempt a cross during open-play. I limited the passing to the attacking half only as this is where most (if not all) crosses will originate from and it avoids the data being skewed by teams that play a lot of passes in their own half.

Similarly to this tweet by OptaJoe, I calculated the average number of open-play crosses that each team in the Premier League required to score a goal from an open-play cross last season. This is shown in the graph below versus the number of attacking half passes per open-play cross.

Relationship between the number of crosses in open-play required to score a goal from a cross in open-play and the number of passes in the attacking half by a team prior to an open-play cross for English Premier League teams in 2011/12. Note that the cross:goal ratio scale is logarithmic and that it is reversed as a larger number is worse. The horizontal dashed black line indicates the average number of open-play crosses required to score a goal from a cross in open-play across the league, while the vertical dashed black line indicates the average number of passes in the attacking half by a team prior to an open-play cross. The teams are coloured by the percentage amount of goals they scored from open-play crosses, relative to their total number of goals in open-play. Data is provided by Opta, WhoScored and EPL-Index.

The analysis indicates that Liverpool did indeed pursue a crossing strategy last season relative to their peers in the Premier League, as they attempted 14 passes in the attacking half prior to attempting a cross. Only Wolves, Stoke and Sunderland played fewer attacking half passes prior to attempting a cross last season. At the other end of the scale, Manchester City and Fulham were relatively sheepish when it came to crossing, attempting just over 21 passes in their opponent’s half prior to attempting a cross. Arsenal, Swansea and Spurs also stood out here, lying more than 1 standard deviation above the league average.

The major issue for Liverpool based on the above analysis was that their conversion from crosses was simply atrocious. They required a staggering 421 open-play crosses to score a single goal in open-play on average last season. This was the worst rate in the whole league, with Wigan the closest on 294. Contrast this with the likes of Manchester United (44.5), Norwich (45.1) and Arsenal (48.4) who were the only clubs to post a value below 50. Furthermore, only 8.3% of Liverpool’s goals in open-play came from an open-play cross. Norwich scored 53.3% of their goals in open-play from open-play crosses

Liverpool seemingly embarked upon a style of play that provided them with a extremely poor return in terms of goals (only 2 goals from an open-play cross all season).

Is crossing the ball an inefficient means of scoring?

The above analysis seemingly demonstrates that Liverpool did indeed pursue a style of play centred around crossing. Liverpool’s apparent quest to show that crossing is an extremely inefficient means of scoring last season (I’m personally still trying to forget those 46 crosses against West Brom at Anfield) potentially clouds the more general question of whether crossing is a tactic worth basing your team around. It could be that crossing can be an efficient way to score but Liverpool were just simply not very good at it.

According to WhoScored, 659 goals were scored in total from open-play, while 241 goals came from set pieces (excluding penalties). The data from Opta show that 166 and 128 goals were scored from open and set-plays respectively. Thus 25% and 53% of all goals in these categories came from crosses. The average number of crosses per goal scored last season was 79 in open-play and 28.3 from a set-piece. Crossing accuracy is also higher for set-pieces (33.9%) compared with open-play (20.5%). This demonstrates that crossing is more effective from set-pieces than in open play.

Crossing the divide

The above analysis demonstrates that Liverpool pursued a playing style overly focussed upon crossing, which yielded very meagre returns. Whether the poor return was a symptom or a contributing factor to their generally poor shot conversion isn’t clear at present and requires further analysis.

The more general question regarding whether crossing is an efficient means of scoring is difficult to assess without more analysis. This study shows that crossing at set-pieces is more efficient than in open-play but to fully answer this question requires comparison with other modes of scoring. The above analysis suggests that structuring your team around crossing in open-play is a very low yield method of scoring, which also results in the loss of possession close to 80% of the time.

Liverpool’s addiction to crossing appears to be a recent trend. In the 3 seasons prior to 2011/12, they averaged 16.4, 15.4 and 15.5 attacking half passes prior to an attempted cross. Swansea under Brendan Rodgers averaged 18.9 last season, which potentially suggests that next season Liverpool will try to kick the crossing habit.

Assessing forward involvement

One of the more interesting innovations from an analytical standpoint at the current European Championship has been the measuring of the amount of time that a player spends with the ball per game. This measure of player involvement has in particular been applied to forward players, such as Mario Gomez. Gomez managed to score 3 goals from 6 shots in 2 games despite only having the ball for 22 seconds, according to Prozone. This contrasted with Robin Van Persie, who was seemingly more involved in general play, scoring 1 goal from 10 shots in 106 seconds.

This prompts the question: can we assess such player involvement on a wider level, with particular focus on forward players?

Without having access to the time in possession statistics, another measure is required. The number of passes per game should give a reasonable approximation of how involved a forward is in general play. Contrasting this with the number of shots attempted per game should provide a comparison between a forwards goal scoring duties and his overall involvement in play.

Top European League analysis

Below is a comparison of the number of shots a forward attempts per game vs the number of passes he attempts per game. The data is taken from WhoScored.com and is for all players classified as forwards and have started 10 games or more in the top division in England, Spain, Italy, Germany and France. The graph includes players who have played in a non-forward role at some point in the season, as defined by WhoScored. For example, Cristiano Ronaldo is classified as playing as both a left-sided attacking midfielder and forward, although in this case the distinction is likely irrelevant. Including players who have at some point played outside of the forward line makes little impact upon the general trend and averages (see table below).

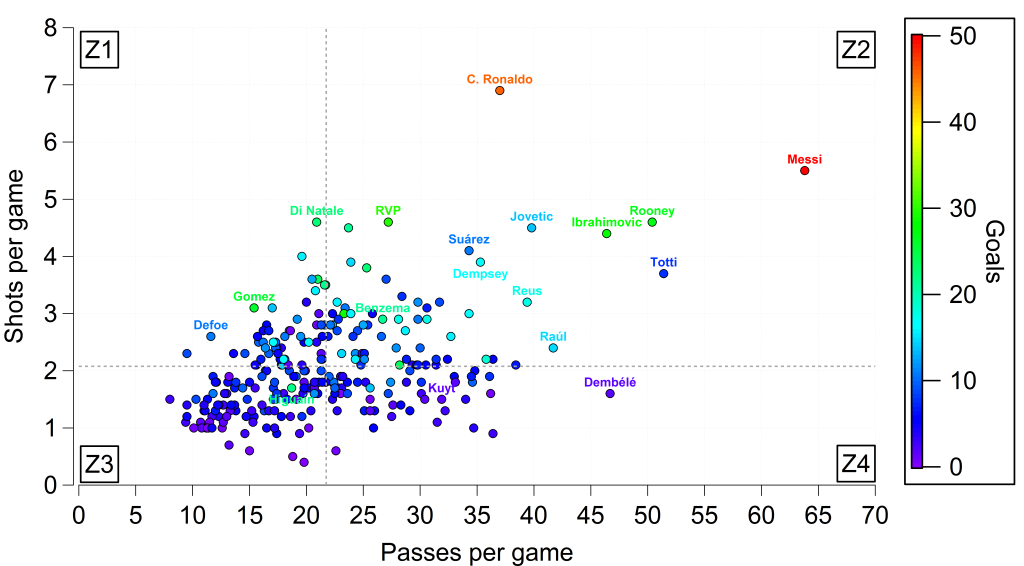
Relationship between number of shots attempted per game vs number of passes attempted per game by forward players in the top division in England, Spain, Italy, Germany and France. The points are coloured by the number of goals scored by each player. The vertical dashed grey line indicates the average number of passes per game by these players, while the horizontal dashed grey line indicates the average number of shots attempted by these players. The text boxes (Z1, Z2, Z3, Z4) designate the zones of interest referred to in the text. All data is taken from WhoScored.com for the 2011/12 season. An interactive version of the plot is available here, where you can find any of the forwards included in the study.

Filter Players Shots/game Passes/game Goals
Forwards only 130 2.06±0.76 18.72±6.24 7.96±5.85
Mixed 135 2.10±1.01 24.67±8.82 8.23±7.57
All 265 2.08±0.89 21.75±8.21 8.10±6.77

Comparison of the different player position classifications prescribed by WhoScored. The mean and standard deviation for shots/game, passes/game and goals scored are given for each group. Mixed refers to players who have been classed as playing as both a forward and another position (generally as an attacking midfielder) at some point in the 2011/12 season.

In general, there is a weak positive relationship between shots attempted and passes attempted by forward players (correlation coefficient of 0.46 if you are that way inclined). The major feature though is that there is a great deal of variability across the forward players in terms of their involvement in player relative to their goal scoring attempts. An interactive version of the plot is available here, where you can find any of the forwards included in the study.

Players such as Mario Gomez and Jermain Defoe take an above average number of shots relative to the number of passes they attempt (Zone 1), with Gomez in particular being prolific for Bayern Munich with 26 goals in 30 Bundesliga starts. Other notable forwards with these traits include Antonio Di Natale, Robert Lewandowski, Edison Cavani, Mario Balotelli and Falcao who attempt a slightly below average number of passes but still attempt a large number of shots per game. Fernando Llorente and Andy Carroll also reside in this zone, with similar values for shots attempted and passes attempted. Players in this zone score 9.6 goals on average.

Several “star” forwards reside in Zone 2, where forwards take an above average number of shots and attempt an above average number of passes. The two extremes here are unsurprisingly Lionel Messi and Cristiano Ronaldo, who attempt the most passes and take the most shots respectively out of all of the forwards in the study. Messi ranks 34th for the number of passes across the top five European leagues, some 30 passes behind his Barcelona team-mate Xavi. Clearly, Messi’s false-nine role for Barcelona allows him to become extremely involved in general play and to even dictate it at times. He combines this with being Barcelona’s primary provider of shots on goal and indeed goals. Ronaldo is also involved significantly in Real Madrid’s play and incredibly attempts almost 7 shots per game. Several other notable forwards in this zone include Francesco Totti, Wayne Rooney, Zlatan Ibrahimovic, Raúl, Luis Suárez and Robin Van Persie with some of these forwards being more prolific than others. Clint Dempsey is an example of someone who generally plays outside of the forward line but is included here as he did play up-front for Fulham this season (scoring 5 goals in 5 games according to WhoScored). Players in this zone score 13.7 goals on average, although this is somewhat skewed by the exploits of Messi and Ronaldo (12.6 goals on average when excluding them).

Out of the 265 players included, 98 attempt both a lower than average number of shots and passes per game. In general, the number of goals scored in this group (Zone 3) is unremarkable, with the average goals scored per player being 5. However, there is one significant over-perfomer; Gonzalo Higuaín scored 22 league goals from 60 shots last season. In most squads, this would guarantee more games but he was up against Karim Benzema, who by comparison scored a paltry 21 goals from 100 shots. However, an added benefit of Benzema based on this analysis is that he is far more involved in general play.

The last group (Zone 4) includes players who take fewer shots than average but attempt more passes than average. Many of these players are more attacking midfield players than forwards, such as Dirk Kuyt. Again, a Fulham player is a good example of a player who rarely plays as a forward being included in the analysis, as Moussa Dembélé generally plays in midfield. Players in this zone score 5.3 goals on average, essentially the same as those in Zone 3.

Finishing the jigsaw

Clearly there is a large variation in how involved a forward player is in general play versus how often he attempts to score. Such differences are likely driven by both the individual player in terms of their skills and style of play alongside their tactical role within the team. Mario Gomez for instance has very similar numbers from the current European Championship for Germany as he does for his club side, although this could be a statistical quirk given the small sample size. It would be interesting to analyse how an individual performs by these measures across multiple games in multiple tactical systems.

There isn’t necessarily a better “zone” in this analysis but teams should bear these traits in mind when attempting to improve their squad. For example, Liverpool’s woes in front of goal last season led for calls for a simple poacher to be brought in who would simply “stick the ball in the net”. However, if by bringing in a poacher, Liverpool were to lose the passing and creativity provided by players in other areas, then you could end up exchanging one problem for another. Balance is key in such decisions; hopefully Brendan Rodgers can solve Liverpool’s goal scoring issues and at least maintain the quality of their chance creation next season.

Resting with the ball

Brendan Rodgers appointment as Liverpool manager has prompted some fascinating discussions about his overall playing philosophy and how it might be transferred to his new club. Swansea’s impressive passing statistics have been much quoted in this context; only Manchester City attempted and completed more than them last season.

An intriguing aspect of this preference for possession is that it is used as both an offensive and defensive tool. Michael Cox of Zonal Marking previously elaborated on the link between possession and shots attempted per game and showed that in general, teams with more possession had more shots, although there was a large degree of variation around the general trend. However, this only investigates the offensive aspect. The theory behind the defensive aspect is best outlined by the new Liverpool manager:

“Then there’s our defensive organisation…so if it is not going well we have a default mechanism which makes us hard to beat and we can pass our way into the game again. Rest with the ball. Then we’ll build again.”

The inference here is that by having the ball, the opposition can’t score while you simultaneously have increased your own chances of scoring as you need the ball in order to score. So the question is: is this true?

One method of ascertaining how well teams accomplish the twin goals of attempting shots on goal and preventing shots on their own goal is to take the ratio between them. If this ratio is greater than 1, then a team attempts more shots than it concedes. Conversely, if the ratio is less than 1, then a team concedes more shots than it attempts. This is by no means a perfect metric, as not all shots are created equal but it does give us something to begin with.

In order to assess whether this has any relationship with passing, I’ve plotted this ratio against the number of short passes attempted per game by each team in the top leagues in England, Spain, Italy, Germany and France in the figure below. The teams from each league are coloured differently and various teams are highlighted for comparison purposes/interest.

Relationship between shots attempted:conceded vs short passes per game from all teams in the top division in England, Spain, Italy, Germany and France. The vertical dashed grey line indicates the average number of short passes per game by these teams, while the horizontal dashed grey line indicates the average shots attempted:conceded ratio. All data is taken from WhoScored.com for the 2011/12 season.

Broadly, teams that attempt more short passes per game tend to attempt more shots than they concede (correlation coefficient of 0.8 if you are that way inclined). Unsurprisingly, the teams at the extreme ends of the number of short passes are Stoke (229 per game) and Barcelona (655 per game). Barcelona are also at the extreme end of the shots attempted:conceded ratio, achieving well above 2 times as many attempted shots compared to those they concede. This is largely driven by their ability to prevent their opponents taking shots, as Barcelona have the lowest number of shots conceded per game (only 7.3 per game). Barcelona’s shots attempted comes in 10th (16.5 per game). Barcelona are adept at “resting with the ball” but you probably already knew that. Many of the teams analysed attempt a below average number of short passes and concede more shots than they attempt. Ajaccio, FC Cologne and Santander posted the lowest shots attempted:conceded ratio, with the latter two being relegated.

Swansea & Liverpool

Swansea are one of the few teams that combined a large number of short passes per game with a well below average shots attempted:conceded ratio. The closest side to Swansea in this sense is Athletic Bilbao, another side who value possession and pressing highly. Clearly Swansea keep the ball well and translated this to a reasonable number of attempted shots per game (12.4, joint 15th highest in the EPL, mid-table across all 5 leagues). Furthermore, Swansea’s patient style of play seeks to create higher quality shooting opportunities; a lower number isn’t necessarily a bad thing as it isn’t artificially inflated by long-range pot-shots that threaten the corner flag rather than the goal.

However, compared to other teams that play an above average number of short passes per game, their shots conceded per game is relatively high (15.7, 7th highest in the EPL). Indeed, of the 11 teams that conceded more shots per game across the five leagues, 8 of them finished in the bottom 4 of their respective leagues (6 were relegated). As mentioned previously, not all shots are created equal but Swansea conceded 59% of these shots within their own penalty area, which was joint 4th highest in the EPL. Without delving further into numbers and analysis, this potentially suggests that Swansea are good at keeping the ball but perhaps were not as good at transitioning to their defensive duties either individually or collectively when they lost it.

Liverpool on average attempted close to 60% more shots than they conceded, with only 8 teams achieving a larger ratio. In Liverpool’s case, this was driven by both being able to execute a large number of shots on their opponent’s goal and combining this with a low number of shots on their own goal. Liverpool ranked 4th for shots attempted in the EPL (6th across all 5 leagues) and 3rd for shots conceded (15th across all 5 leagues). This was combined with the 7th highest number of short passes per game in the EPL. As has been shown many times over the past season, Liverpool’s major problem statistically was their woeful translation of shots to goals.

The way forward for Liverpool

Liverpool under Kenny Dalglish were hardly a team that could be described as a “route one” football team, although the passing style was at times impatient and overly focussed upon crossing to what often seemed like unidentified targets in the penalty area. However, there is a significant difference between the number of short passes played by Swansea (497 per game) compared to Liverpool (440 per game). Next season, Liverpool will presumably move towards and perhaps exceed 500 short passes per game as the influence of Rodgers’ possession orientated playing philosophy takes hold. At the very least, Liverpool should be looking to maintain their shots attempted:conceded ratio from last season to the next. A more patient style of play may help to deliver more players in the final third in order to create and take shooting opportunities. If such patience also delivers some more-composed finishing, then Liverpool under Brendan Rodgers could be very exciting indeed.

——————————————————————————————————————–

Credit

All the raw data is taken from WhoScored.com.

The quote from Brendan Rodgers is taken from the excellent analysis by Jed Davies which is linked below.

Further reading

  1. Roy Henderson on The Anfield Wrap
  2. Stephen McCarthy on EPL Index
  3. Mihail Vladimirov on The Tomkins Times (£)
  4. Jed Davies on The Path is Made By Walking