Newcastle United vs Liverpool: passing network analysis

Liverpool defeated Newcastle 6-0 at St James’ Park. Below is the passing network analysis for Liverpool split between the first 75 minutes of the match and the rest of the match up to full time. I focussed just on Liverpool here. More information on how these are put together is available here in my previous posts on this subject.

The reason I separated the networks into these two periods was that I noticed how Liverpool’s passing rate changed massively after Steven Gerrard was substituted and the fifth goal was scored. During the first 75 minutes, Liverpool attempted 323 passes with a success rate of 74% and a 45% share of possession. After this, Liverpool attempted 163 passes with an accuracy of 96% and a 60% share of possession. Liverpool attempted 34% of their passes in this closing period. Let’s see how this looks in terms of their passing network.

The positions of the players are loosely based on the formations played, although some creative license is employed for clarity. It is important to note that these are fixed positions, which will not always be representative of where a player passed/received the ball. The starting eleven is shown on the pitch for the first 75 minutes, with Borini replacing Gerrard in the second network.

Passing networks for Liverpool for the first and second halfs against Swansea City from the match at Anfield on the 17th February 2013. Only completed passes are shown. Darker and thicker arrows indicate more passes between each player. The player markers are sized according to their passing influence, the larger the marker, the greater their influence. Players with an * next to their name were substituted. Click on the image for a larger view.

Passing networks for Liverpool for the first 75 minutes and up to full time against Newcastle United from the match at St James’ Park on the 27th April 2013. Only completed passes are shown. Darker and thicker arrows indicate more passes between each player. The player markers are sized according to their passing influence, the larger the marker, the greater their influence. Click on the image for a larger view.

Liverpool’s passing was quite balanced for the first 75 minutes of the match, with a varied passing distribution. There was a stronger bias towards the right flank compared with the left flank as Gerrard drifted right to combine with Johnson and Downing. The passing influence scores were also evenly distributed across the whole team with Gerrard and Lucas being the top two. A contrast with some previous matches is the lack of strong links along the back line, which indicates less reliance on recycling of possession in deeper areas. Instead, Liverpool were seeking to move the ball forward more quickly and played the ball through the whole team.

He makes us happy

After Gerrard and Lucas, the next most influential player was Coutinho, who put in a wonderfully creative performance as the attacking fulcrum of the team. He linked well with all of Liverpool’s forward players and threaded several dangerous passes to his team-mates including an assist and a ‘second goal assist’ (defined as a pass to the goal assist creator) for the second goal according to EPL-Index. His creative exploits thus far have been hugely promising during his first 10 appearances.

Sterile domination

The final period of the match saw Liverpool really rack up the passing numbers as mentioned earlier. Clearly, this is easier to do when 5 or 6 goals clear but it is still potentially illustrative to see how this was accomplished. The main orchestrator’s of this were Lucas and Henderson who were 28/28 and 35/35 for passes attempted/completed during this period. Henderson was 21/24 from the first 75 minutes, so this was quite a rapid increase with his shift in role after Gerrard went off and the state of the game.

Your challenge should you wish to accept it

Admittedly Newcastle were very poor in this match but Liverpool took advantage to enact a severe thrashing. This was accomplished without Suárez, which leads to obvious (premature?) questions about whether his absence improved Liverpool’s overall balance and play. Assuming that Suárez doesn’t leave in the summer, one of Bredan Rodgers’ key tasks will be developing a system that gets the best out of the attacking talents of Suárez, Coutinho and Sturridge. It could be quite tasty if he manages to accomplish this.
Advertisement

Crossing efficiency: open-play vs set-play

In my previous post, I looked at how Liverpool seemingly focussed upon crossing last season and how it was on the whole unsuccessful, at least in open-play. One thing that I noted was that crossing from set-pieces appeared to be more successful in terms of goals scored than crosses in open-play.

The average number of crosses per goal scored last season was 79 in open-play and 28.3 from a set-piece. Crossing accuracy is also higher for set-pieces (33.9%) compared with open-play (20.5%). This demonstrates that crossing is more effective from set-pieces than in open play.

So the question is: Which teams were particularly efficient at scoring from set-play crosses and how did this contrast with their open-play performance?

Crossing efficiency

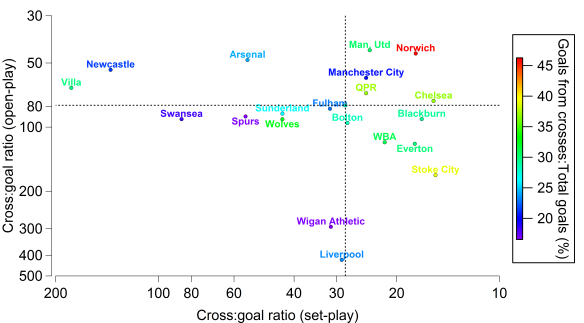
As with the crosses from open-play analysis, there are several under and over-performers in terms of crosses from set-pieces. Furthermore, some teams score a large proportion of their goals from crosses.

Relationship between the number of crosses in open-play required to score a goal from a cross in open-play and the number of crosses from a set-play required to score a goal from a cross at a set-play for English Premier League teams in 2011/12. Note that both scales are logarithmic and that they are reversed as a larger number is worse. The horizontal dashed black line indicates the average number of open-play crosses required to score a goal from a cross in open-play across the league, while the vertical dashed black line indicates the number of crosses from a set-play required to score a goal from a cross at a set-play. The teams are coloured by the percentage amount of goals they scored from all crosses, relative to their total number of goals. Data is provided by Opta and EPL-Index.

Stoke conformed to their stereotype here as they led the way marginally from Chelsea, as they required 15.4 crosses per goal at a set-piece compared to Chelsea’s 15.6. Chelsea scored 14 goals in total from set-pieces, while Stoke scored 10. Other notable performers were Blackburn (16.9), Norwich (17.6) and Everton (17.7). Norwich were probably the most efficient crossing team in the league last season, as they scored frequently compared to their peers from both open-play and set-pieces. In fact, 46% of their goals came from crosses last season, ahead of Stoke (39%), QPR (37%) and Chelsea (37%). Whether such numbers will be sustainable next season could be crucial for Norwich under Chris Hughton.

Aston Villa (180), Newcastle (138) and Swansea (85.5) were the clearest under-achievers, as they only scored 4 goals from a set-piece cross between them. In contrast to their severe under-performance in the open-play crossing analysis, Liverpool were about average as far as set-piece crosses were concerned. Indeed, Liverpool scored 9 goals from set-piece crosses last season, which was joint third with Blackburn, Everton and West Brom.

Getting to the byline

One of the aspects of crossing that I find curious is the poor success rate of crosses in terms of their accuracy. At first glance, the accuracy of crosses appears to be uniformly low; 23.4% for all crosses, with Arsenal posting the lowest (21.5%) and Norwich having the highest (27.3%). Accuracy is even worse in open-play, where it drops to 20.5% on average last season. Norwich are again the highest (24.8%), while Bolton had the lowest (17.2%). The overall crossing accuracy figures are skewed by the greater accuracy from set-piece crosses, which on average were accurate 33.9% of the time. Newcastle had the lowest accuracy with 23.9%, which was far lower than any other side (Liverpool were next lowest with 29.1%). Such a low accuracy goes some way to explaining their poor efficiency from set-piece crosses. The contrast to this is Aston Villa, who amazingly had the highest set-piece cross accuracy with 41.7% but could only score 1 goal from a set-piece cross all season.

This greater range and contrast in crossing accuracy when they are broken down potentially points towards a level of granularity in the crossing data, that is not separated by the coarse definition of crosses used here. Ideally, the crosses would be separated by the position from which the cross originated, along with defending and attacking players positioning. EPL-Index include “byline crosses” in their crossing database, which is a start as it shows that such crosses are far more accurate on average (47.8%). If we assume that successfully crossing to a team-mate is the first stage in potentially creating a chance to shoot and subsequently scoring, then it would appear that byline crosses are a far better option than other crosses in open-play; open-play crosses excluding these byline crosses have an accuracy of 19.7%.

Sadly I don’t have enough information available to assess whether byline crosses are a more efficient means of scoring from a cross plus the sample size is relatively small compared to total open-play crosses on a team-by-team basis. Some teams essentially never get to the byline and cross the ball; Stoke attempted only 2 byline crosses all season. Only Manchester City (50), Arsenal (47), Liverpool (34) and Manchester United (31) really attempted enough to draw even tentative conclusions. However, it would make sense if such crosses were a more effective means of scoring from a cross as they are often attempted closer to goal, which may result in an easier chance for the receiver.

In the mixer

Based on last season, set-piece crosses are a more efficient means of scoring than open-play crosses. There are likely a multitude of reasons for this, one of which is possibly the superior crossing accuracy from set-pieces compared to those in open-play. The greater parity in numbers between attackers and defenders could be another reason plus the more specialised headers of the ball, such as centre-backs, could be used to greater effect at set-pieces. One potential method of extracting more value from crosses is to attempt them closer to the byline, where the accuracy is far greater than other open-play crosses but at present I don’t have enough data to fully explore this idea.

Overall, scoring from a cross does not appear to be a particularly efficient and direct method of providing goals. However, it could be argued that a goal may indirectly result from a cross; the “in the mixer” approach, although this is likely to be particularly subject to the vagaries of luck and is more applicable to set-pieces. Based on last season, a team will on average score a goal from a cross in open-play every 79 crosses. Even the best performers in the league needed 45 crosses on average to score a single goal. The average number of open-play crosses per game attempted by a team last season was 17, which suggests that over the long-term, a team can expect to at best score a goal from an open-play cross every 2-3 games. Crossing, especially in open-play, appears to be a low-yield method of scoring.

If Liverpool had been merely average last season, the 841 open-play crosses they attempted would have yielded an extra 8 goals. If they had been exceptional, they could have expected another 16 goals. The question is whether this is a good enough return to motivate basing your playing style upon over the long-term?

A cross to bear: Liverpool’s crossing addiction in 2011/12

In some recent interviews, Simon Kuper has suggested that Liverpool established a data-driven style of play focussed around crossing last season. He theorised that Liverpool attempted to cater to Andy Carroll’s heading strengths by buying players with good crossing statistics, such as Stewart Downing and Jordan Henderson. Kuper then goes on to state that such an approach is flawed due to crossing being an inefficient means of scoring goals.

Earlier in the season, the Guardian’s Secret Footballer also suggested that statistical principles guided Damien Comolli towards a crossing focussed approach in the transfer market. Andrew Beasley conducted an excellent analysis for The Tomkins Times on whether the data indicated that such an approach (along with some others) was actually working.

So the question is: Did Liverpool really pursue a strategy based around crossing last season and to what extent was it successful (you can probably guess the answer to the second part)?

Noughts & Crosses

Firstly, Opta define a cross as:

A pass from a wide position into a specific area in front of the goal.

The basic numbers show that Liverpool attempted more crosses (1102) than any other team in the Premier League last season. Manchester United (1018) and Wolves (999) ranked second and third respectively. At the other end of the scale, Blackburn (610), Fulham (649) and Swansea (721) attempted the fewest. The average per team was 837.2 crosses attempted, which equates to just over 22 crosses per game.

While the raw numbers provide a guide, it is possible that the figures could be skewed by how much of the ball a particular team has on average. For example, Wolves had much less of the ball than Manchester United last season but attempted a similar number of crosses. This suggests that Wolves were keener to attempt crosses than Manchester United. Furthermore, set-plays should be isolated from the total crosses, as teams may have different approaches in open-play vs set-play. In order to account for this, I’ve calculated the ratio of attacking half passes to total open-play crosses in the graph below. This gives an indication of how keen a team is to attempt a cross during open-play. I limited the passing to the attacking half only as this is where most (if not all) crosses will originate from and it avoids the data being skewed by teams that play a lot of passes in their own half.

Similarly to this tweet by OptaJoe, I calculated the average number of open-play crosses that each team in the Premier League required to score a goal from an open-play cross last season. This is shown in the graph below versus the number of attacking half passes per open-play cross.

Relationship between the number of crosses in open-play required to score a goal from a cross in open-play and the number of passes in the attacking half by a team prior to an open-play cross for English Premier League teams in 2011/12. Note that the cross:goal ratio scale is logarithmic and that it is reversed as a larger number is worse. The horizontal dashed black line indicates the average number of open-play crosses required to score a goal from a cross in open-play across the league, while the vertical dashed black line indicates the average number of passes in the attacking half by a team prior to an open-play cross. The teams are coloured by the percentage amount of goals they scored from open-play crosses, relative to their total number of goals in open-play. Data is provided by Opta, WhoScored and EPL-Index.

The analysis indicates that Liverpool did indeed pursue a crossing strategy last season relative to their peers in the Premier League, as they attempted 14 passes in the attacking half prior to attempting a cross. Only Wolves, Stoke and Sunderland played fewer attacking half passes prior to attempting a cross last season. At the other end of the scale, Manchester City and Fulham were relatively sheepish when it came to crossing, attempting just over 21 passes in their opponent’s half prior to attempting a cross. Arsenal, Swansea and Spurs also stood out here, lying more than 1 standard deviation above the league average.

The major issue for Liverpool based on the above analysis was that their conversion from crosses was simply atrocious. They required a staggering 421 open-play crosses to score a single goal in open-play on average last season. This was the worst rate in the whole league, with Wigan the closest on 294. Contrast this with the likes of Manchester United (44.5), Norwich (45.1) and Arsenal (48.4) who were the only clubs to post a value below 50. Furthermore, only 8.3% of Liverpool’s goals in open-play came from an open-play cross. Norwich scored 53.3% of their goals in open-play from open-play crosses

Liverpool seemingly embarked upon a style of play that provided them with a extremely poor return in terms of goals (only 2 goals from an open-play cross all season).

Is crossing the ball an inefficient means of scoring?

The above analysis seemingly demonstrates that Liverpool did indeed pursue a style of play centred around crossing. Liverpool’s apparent quest to show that crossing is an extremely inefficient means of scoring last season (I’m personally still trying to forget those 46 crosses against West Brom at Anfield) potentially clouds the more general question of whether crossing is a tactic worth basing your team around. It could be that crossing can be an efficient way to score but Liverpool were just simply not very good at it.

According to WhoScored, 659 goals were scored in total from open-play, while 241 goals came from set pieces (excluding penalties). The data from Opta show that 166 and 128 goals were scored from open and set-plays respectively. Thus 25% and 53% of all goals in these categories came from crosses. The average number of crosses per goal scored last season was 79 in open-play and 28.3 from a set-piece. Crossing accuracy is also higher for set-pieces (33.9%) compared with open-play (20.5%). This demonstrates that crossing is more effective from set-pieces than in open play.

Crossing the divide

The above analysis demonstrates that Liverpool pursued a playing style overly focussed upon crossing, which yielded very meagre returns. Whether the poor return was a symptom or a contributing factor to their generally poor shot conversion isn’t clear at present and requires further analysis.

The more general question regarding whether crossing is an efficient means of scoring is difficult to assess without more analysis. This study shows that crossing at set-pieces is more efficient than in open-play but to fully answer this question requires comparison with other modes of scoring. The above analysis suggests that structuring your team around crossing in open-play is a very low yield method of scoring, which also results in the loss of possession close to 80% of the time.

Liverpool’s addiction to crossing appears to be a recent trend. In the 3 seasons prior to 2011/12, they averaged 16.4, 15.4 and 15.5 attacking half passes prior to an attempted cross. Swansea under Brendan Rodgers averaged 18.9 last season, which potentially suggests that next season Liverpool will try to kick the crossing habit.