This is a short follow-up to this post using the same dataset. Instead of shot conversion, we’re now looking at shooting accuracy which is defined as the number of shots on target divided by the total number of shots. The short story here is that shooting accuracy regresses more strongly to the mean than shot conversion at the larger shot samples (more than 70 shots) and is very similar below this.
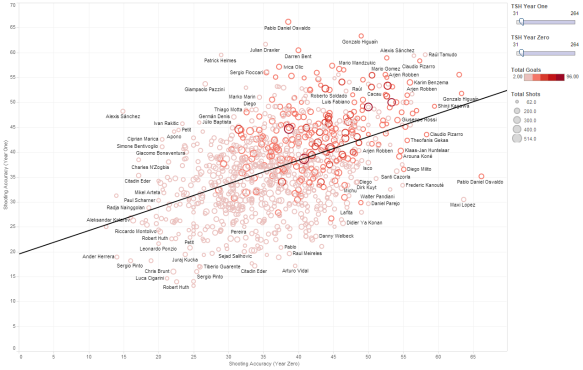
Comparison between shooting accuracy for players in year zero and the following season (year one). Click on the image or here for a larger interactive version.
| Minimum Shots | Players | year-to-year r^2 | ‘luck’ | ‘skill’ |
|---|---|---|---|---|
| 1 | 2301 | 0.045 | 79% | 21% |
| 10 | 1865 | 0.118 | 66% | 34% |
| 20 | 1428 | 0.159 | 60% | 40% |
| 30 | 951 | 0.214 | 54% | 46% |
| 40 | 632 | 0.225 | 53% | 47% |
| 50 | 456 | 0.219 | 53% | 47% |
| 60 | 311 | 0.190 | 56% | 44% |
| 70 | 180 | 0.245 | 51% | 49% |
| 80 | 117 | 0.305 | 45% | 55% |
| 90 | 75 | 0.341 | 42% | 58% |
| 100 | 43 | 0.359 | 40% | 60% |
Comparison of the level of ‘skill’ and ‘luck’ attributed to shooting accuracy (measured by shots on target divided by all shots) from one season to the next. The data is filtered by the total number of shots a player takes in consecutive seasons.
Essentially, there is quite a bit of luck involved with getting shots on target and for large-volume shooters, there is more luck involved in getting accurate shots in than in scoring them.
Pingback: StatsBomb | The Spanish Inquisition – Roberto Soldado
Great article. Unfortunately, full size graph doesn’t work any more.
Thanks and sorry for the delay with moderating this. Looks like something has gone wrong at the Tableau end. I’ll look into it.