In my two previous posts, I’ve investigated crossing frequency and crossing efficiency from both open and set-play. Much of those posts focussed upon Liverpool and their apparent addiction to crossing in 2011/12. One of the major questions surrounded whether this apparent crossing strategy was a phenomenon that had evolved from Liverpool’s transfer business last summer as the club sought to provide aerial service to Andy Carroll.
So the question is: did Liverpool cross more often in 2011/12 compared with 2010/11 under Kenny Dalglish?
Crossing comparison
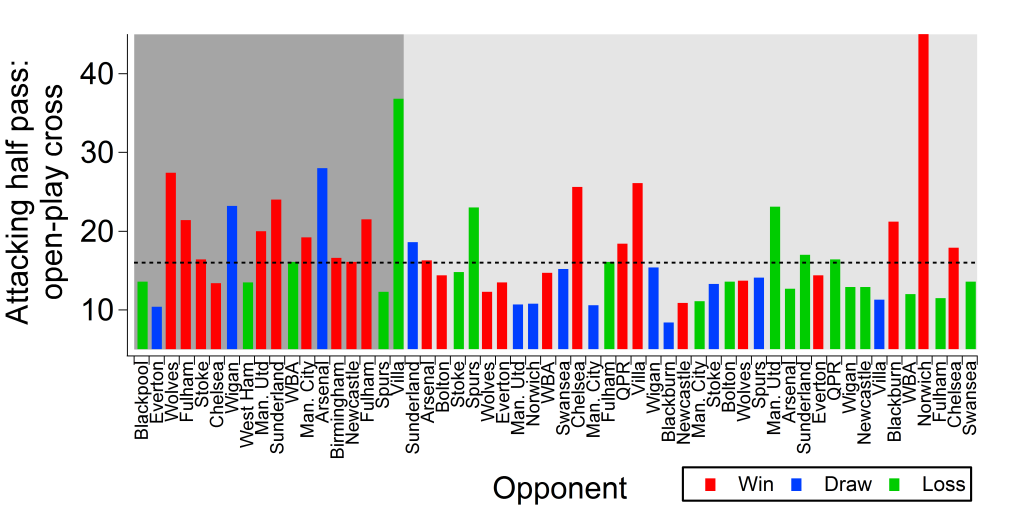
Overall, Liverpool averaged 17.4 attacking half passes prior to an open-play cross in 2010/11, compared to 14 in 2011/12. Such a difference is statistically significant at the 99% level. Consequently, it would appear that Liverpool did indeed cross more in 2011/12 than in 2010/11 under Dalglish. However, this isn’t the whole story as the plot below investigates. Liverpool’s crossing frequency tended to fluctuate from game-to-game, although this is to be expected. In general, during 2010/11, they were above the average from last season. Conversely, during 2011/12, they were below the average.

The average number of passes attempted in the attacking half by Liverpool prior to an open-play cross in Premier League games while managed by Kenny Dalglish. Each bar is coloured according to whether Liverpool won, drew or lost the game. Dark grey background is for games in 2010/11 and lighter grey background is for games in 2011/12. The dashed black line is the average number of attacking half passes attempted prior to an open-play cross for all teams in the 2011/12 season. Data is provided by EPL-Index.
A complicating factor of the comparison between the two seasons is that Liverpool’s record in terms of wins and points won was much better pro-rata in 2010/11 than in 2011/12. Over the whole of Dalglish’s second tenure, Liverpool averaged 17.2 attacking half passes per open-play cross in games which they won, 14.4 in those that they lost and 12.8 in games which they drew. Combining those in which they failed to win (draws plus losses), they averaged 13.7. Limiting the analysis to just 2011/12, Liverpool averaged 16.2 during a win,14.1 during a loss and 12.1 during a draw. In losses and draws combined, they averaged 13.1. It would appear that score effects played a role in Liverpool’s crossing strategy, although this analysis is limited to just the final score (ideally you would investigate the crossing frequency as a game unfolds and the score changes).
A desperate measure
It appears that Liverpool did cross more frequently in 2011/12 than in 2010/11 under Kenny Dalglish. This may well have been a result of the transfer business conducted in 2011. However, the change in style is somewhat conditioned by their poorer record in terms of wins and points gained. In games that they failed to win and particularly during home draws, Liverpool crossed more frequently. Was this a desperate measure as they attempted to force a result during these games? Cross after cross was sent into the area but generally yielded very little return.
The apparent willingness of Brendan Rodgers to sell Andy Carroll has been attributed to a perception that he won’t fit in with Rodgers’ possession-based style of play. Furthermore, it might be that Carroll is seen as too tempting a target for long balls and crosses from the rest of the team. Based on last season, Liverpool averaged 13.3 attacking half passes prior to a cross when Carroll started and played more than 60 minutes. When Carroll didn’t start, Liverpool averaged 14.9. This would suggest that Liverpool did cross more frequently when Carroll played, although such “with or without you analyses” are notoriously difficult as compounding factors can sway the results. One such compounding factor is that Liverpool’s win record was better when Carroll started and we already know that Liverpool crossed less when they won.
In summary, Liverpool did cross more during 2011/12 than in 2010/11 but this may have been somewhat skewed by the poorer record during the former. Possibly the more concerning aspect is that Liverpool tended to cross more when they were losing or drawing, which brought very little return. This seemingly desperate tactic led to much frustration and likely contributed to the loss of points over the course of the season. Ultimately, this poor points return cost Kenny Dalglish his job.