Liverpool’s crossing addiction in 2011/12: a desperate measure?

In my two previous posts, I’ve investigated crossing frequency and crossing efficiency from both open and set-play. Much of those posts focussed upon Liverpool and their apparent addiction to crossing in 2011/12. One of the major questions surrounded whether this apparent crossing strategy was a phenomenon that had evolved from Liverpool’s transfer business last summer as the club sought to provide aerial service to Andy Carroll.

So the question is: did Liverpool cross more often in 2011/12 compared with 2010/11 under Kenny Dalglish?

Crossing comparison

Overall, Liverpool averaged 17.4 attacking half passes prior to an open-play cross in 2010/11, compared to 14 in 2011/12. Such a difference is statistically significant at the 99% level. Consequently, it would appear that Liverpool did indeed cross more in 2011/12 than in 2010/11 under Dalglish. However, this isn’t the whole story as the plot below investigates. Liverpool’s crossing frequency tended to fluctuate from game-to-game, although this is to be expected. In general, during 2010/11, they were above the average from last season. Conversely, during 2011/12, they were below the average.
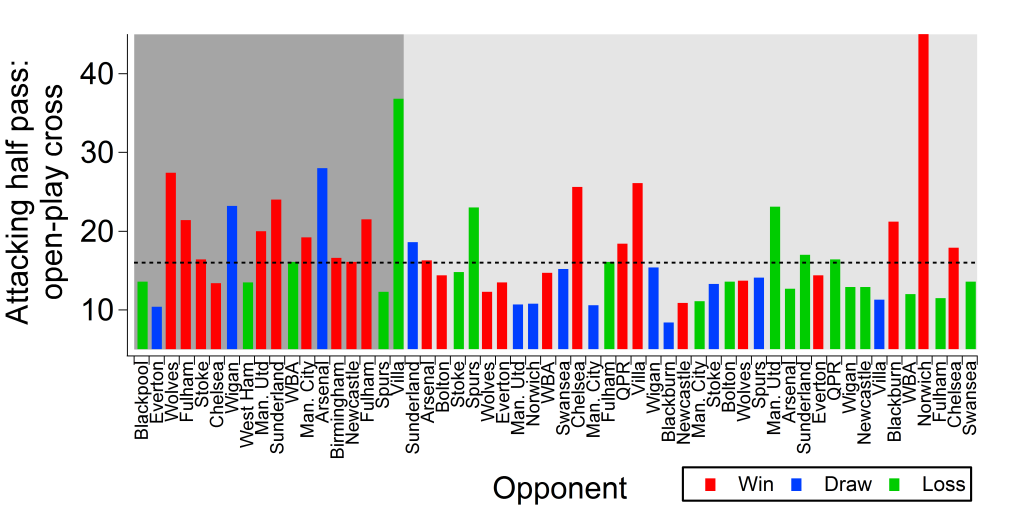
The average number of passes attempted in the attacking half by Liverpool prior to an open-play cross in Premier League games while managed by Kenny Dalglish. Each bar is coloured according to whether Liverpool won, drew or lost the game. Dark grey background is for games in 2010/11 and lighter grey background is for games in 2011/12. The dashed black line is the average number of attacking half passes attempted prior to an open-play cross for all teams in the 2011/12 season. Data is provided by EPL-Index.

A complicating factor of the comparison between the two seasons is that Liverpool’s record in terms of wins and points won was much better pro-rata in 2010/11 than in 2011/12. Over the whole of Dalglish’s second tenure, Liverpool averaged 17.2 attacking half passes per open-play cross in games which they won, 14.4 in those that they lost and 12.8 in games which they drew. Combining those in which they failed to win (draws plus losses), they averaged 13.7. Limiting the analysis to just 2011/12, Liverpool averaged 16.2 during a win,14.1 during a loss and 12.1 during a draw. In losses and draws combined, they averaged 13.1. It would appear that score effects played a role in Liverpool’s crossing strategy, although this analysis is limited to just the final score (ideally you would investigate the crossing frequency as a game unfolds and the score changes).

A desperate measure

It appears that Liverpool did cross more frequently in 2011/12 than in 2010/11 under Kenny Dalglish. This may well have been a result of the transfer business conducted in 2011. However, the change in style is somewhat conditioned by their poorer record in terms of wins and points gained. In games that they failed to win and particularly during home draws, Liverpool crossed more frequently. Was this a desperate measure as they attempted to force a result during these games? Cross after cross was sent into the area but generally yielded very little return.

The apparent willingness of Brendan Rodgers to sell Andy Carroll has been attributed to a perception that he won’t fit in with Rodgers’ possession-based style of play. Furthermore, it might be that Carroll is seen as too tempting a target for long balls and crosses from the rest of the team. Based on last season, Liverpool averaged 13.3 attacking half passes prior to a cross when Carroll started and played more than 60 minutes. When Carroll didn’t start, Liverpool averaged 14.9. This would suggest that Liverpool did cross more frequently when Carroll played, although such “with or without you analyses” are notoriously difficult as compounding factors can sway the results. One such compounding factor is that Liverpool’s win record was better when Carroll started and we already know that Liverpool crossed less when they won.

In summary, Liverpool did cross more during 2011/12 than in 2010/11 but this may have been somewhat skewed by the poorer record during the former. Possibly the more concerning aspect is that Liverpool tended to cross more when they were losing or drawing, which brought very little return. This seemingly desperate tactic led to much frustration and likely contributed to the loss of points over the course of the season. Ultimately, this poor points return cost Kenny Dalglish his job.
Advertisement

Assessing forward involvement

One of the more interesting innovations from an analytical standpoint at the current European Championship has been the measuring of the amount of time that a player spends with the ball per game. This measure of player involvement has in particular been applied to forward players, such as Mario Gomez. Gomez managed to score 3 goals from 6 shots in 2 games despite only having the ball for 22 seconds, according to Prozone. This contrasted with Robin Van Persie, who was seemingly more involved in general play, scoring 1 goal from 10 shots in 106 seconds.

This prompts the question: can we assess such player involvement on a wider level, with particular focus on forward players?

Without having access to the time in possession statistics, another measure is required. The number of passes per game should give a reasonable approximation of how involved a forward is in general play. Contrasting this with the number of shots attempted per game should provide a comparison between a forwards goal scoring duties and his overall involvement in play.

Top European League analysis

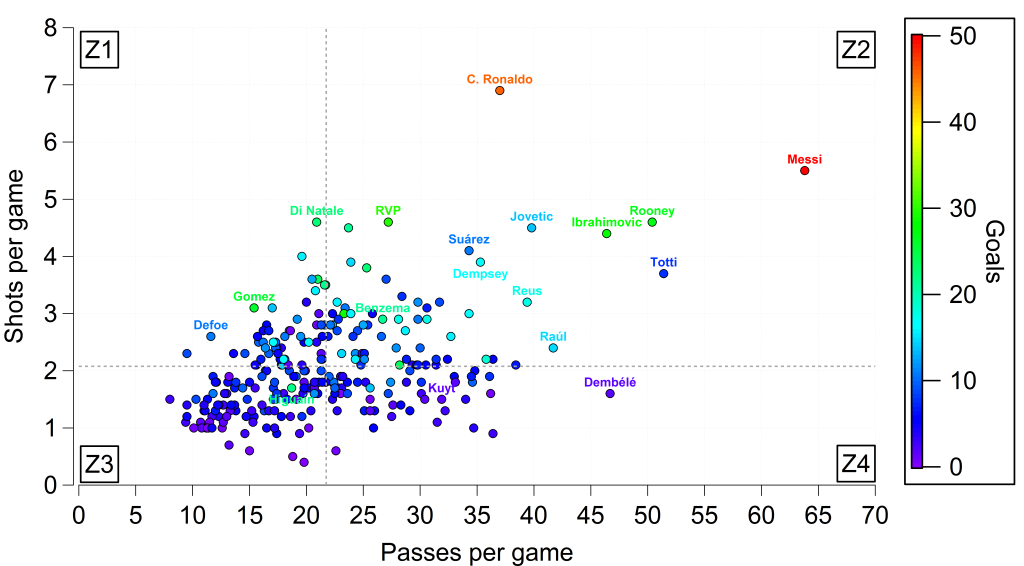
Below is a comparison of the number of shots a forward attempts per game vs the number of passes he attempts per game. The data is taken from WhoScored.com and is for all players classified as forwards and have started 10 games or more in the top division in England, Spain, Italy, Germany and France. The graph includes players who have played in a non-forward role at some point in the season, as defined by WhoScored. For example, Cristiano Ronaldo is classified as playing as both a left-sided attacking midfielder and forward, although in this case the distinction is likely irrelevant. Including players who have at some point played outside of the forward line makes little impact upon the general trend and averages (see table below).

Relationship between number of shots attempted per game vs number of passes attempted per game by forward players in the top division in England, Spain, Italy, Germany and France. The points are coloured by the number of goals scored by each player. The vertical dashed grey line indicates the average number of passes per game by these players, while the horizontal dashed grey line indicates the average number of shots attempted by these players. The text boxes (Z1, Z2, Z3, Z4) designate the zones of interest referred to in the text. All data is taken from WhoScored.com for the 2011/12 season. An interactive version of the plot is available here, where you can find any of the forwards included in the study.

Filter Players Shots/game Passes/game Goals
Forwards only 130 2.06±0.76 18.72±6.24 7.96±5.85
Mixed 135 2.10±1.01 24.67±8.82 8.23±7.57
All 265 2.08±0.89 21.75±8.21 8.10±6.77

Comparison of the different player position classifications prescribed by WhoScored. The mean and standard deviation for shots/game, passes/game and goals scored are given for each group. Mixed refers to players who have been classed as playing as both a forward and another position (generally as an attacking midfielder) at some point in the 2011/12 season.

In general, there is a weak positive relationship between shots attempted and passes attempted by forward players (correlation coefficient of 0.46 if you are that way inclined). The major feature though is that there is a great deal of variability across the forward players in terms of their involvement in player relative to their goal scoring attempts. An interactive version of the plot is available here, where you can find any of the forwards included in the study.

Players such as Mario Gomez and Jermain Defoe take an above average number of shots relative to the number of passes they attempt (Zone 1), with Gomez in particular being prolific for Bayern Munich with 26 goals in 30 Bundesliga starts. Other notable forwards with these traits include Antonio Di Natale, Robert Lewandowski, Edison Cavani, Mario Balotelli and Falcao who attempt a slightly below average number of passes but still attempt a large number of shots per game. Fernando Llorente and Andy Carroll also reside in this zone, with similar values for shots attempted and passes attempted. Players in this zone score 9.6 goals on average.

Several “star” forwards reside in Zone 2, where forwards take an above average number of shots and attempt an above average number of passes. The two extremes here are unsurprisingly Lionel Messi and Cristiano Ronaldo, who attempt the most passes and take the most shots respectively out of all of the forwards in the study. Messi ranks 34th for the number of passes across the top five European leagues, some 30 passes behind his Barcelona team-mate Xavi. Clearly, Messi’s false-nine role for Barcelona allows him to become extremely involved in general play and to even dictate it at times. He combines this with being Barcelona’s primary provider of shots on goal and indeed goals. Ronaldo is also involved significantly in Real Madrid’s play and incredibly attempts almost 7 shots per game. Several other notable forwards in this zone include Francesco Totti, Wayne Rooney, Zlatan Ibrahimovic, Raúl, Luis Suárez and Robin Van Persie with some of these forwards being more prolific than others. Clint Dempsey is an example of someone who generally plays outside of the forward line but is included here as he did play up-front for Fulham this season (scoring 5 goals in 5 games according to WhoScored). Players in this zone score 13.7 goals on average, although this is somewhat skewed by the exploits of Messi and Ronaldo (12.6 goals on average when excluding them).

Out of the 265 players included, 98 attempt both a lower than average number of shots and passes per game. In general, the number of goals scored in this group (Zone 3) is unremarkable, with the average goals scored per player being 5. However, there is one significant over-perfomer; Gonzalo Higuaín scored 22 league goals from 60 shots last season. In most squads, this would guarantee more games but he was up against Karim Benzema, who by comparison scored a paltry 21 goals from 100 shots. However, an added benefit of Benzema based on this analysis is that he is far more involved in general play.

The last group (Zone 4) includes players who take fewer shots than average but attempt more passes than average. Many of these players are more attacking midfield players than forwards, such as Dirk Kuyt. Again, a Fulham player is a good example of a player who rarely plays as a forward being included in the analysis, as Moussa Dembélé generally plays in midfield. Players in this zone score 5.3 goals on average, essentially the same as those in Zone 3.

Finishing the jigsaw

Clearly there is a large variation in how involved a forward player is in general play versus how often he attempts to score. Such differences are likely driven by both the individual player in terms of their skills and style of play alongside their tactical role within the team. Mario Gomez for instance has very similar numbers from the current European Championship for Germany as he does for his club side, although this could be a statistical quirk given the small sample size. It would be interesting to analyse how an individual performs by these measures across multiple games in multiple tactical systems.

There isn’t necessarily a better “zone” in this analysis but teams should bear these traits in mind when attempting to improve their squad. For example, Liverpool’s woes in front of goal last season led for calls for a simple poacher to be brought in who would simply “stick the ball in the net”. However, if by bringing in a poacher, Liverpool were to lose the passing and creativity provided by players in other areas, then you could end up exchanging one problem for another. Balance is key in such decisions; hopefully Brendan Rodgers can solve Liverpool’s goal scoring issues and at least maintain the quality of their chance creation next season.