In this previous post, I combined territory and possession to create a Territorial-Possession Dominance (TPD) metric. The central basis for this metric is that it is more difficult to pass the ball into dangerous areas. Essentially teams that have the ball in areas closer to their opponent’s goal, while stopping their opponent moving the ball close to their own, will score more highly on this metric.
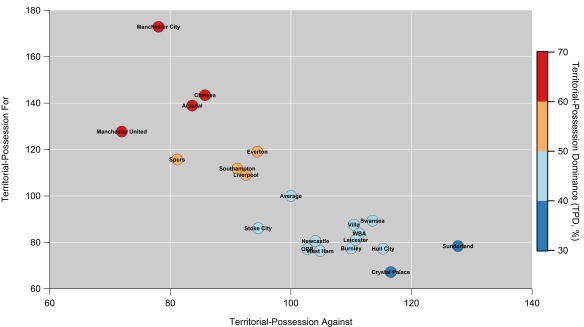
In the graphic below, I’ve looked at how the teams in the Premier League have been shaping up this year (data correct up to 24/04/15). The plot splits this performance on the offensive side (with the ball) and the defensive side (without the ball). For a frame of reference, league average is defined as a score of 100.
Broadly, these two terms show that teams who dominate territory with the ball also limit the amount of possession they concede close to their own goal. This makes sense given there is only one ball on the pitch, so pinning your opponent back in their half makes it more difficult to maintain possession in dangerous areas in return. Alternatively, teams may choose to sit back, soak up pressure and then aim to counter attack; this would yield a low rating offensively and a higher rating defensively.

Territorial-possession for and against for the 2014/15 English Premier League. A score of 100 denotes league average. Marker colour refers to Territorial-Possession Dominance. Data via Opta.
The top seven (plus Everton) tend to dominate territory and possession, while the bottom thirteen (minus Everton) are typically pinned back. Stoke City are somewhat peculiar, as they are below average on both scores,so while they limit their opponents, they seemingly struggle to manoeuvre the ball into dangerous areas themselves. Michael Caley’s expected goals numbers suggest that Everton have seemingly struggled to convert their territorial and possession dominance into an abundance of good quality chances; essentially they look pretty in-between both boxes.
Sunderland’s passivity is evident as they routinely saw their opponents pass the ball into dangerous areas; based on where their defensive actions occur and the league-leading number of shots from outside of the box they concede, the aim is to get men behind the ball and prevent good quality chances from being created. That is possibly a reasonable tactical system if you can combine that with swift counter-attacking and high quality chances but Poyet’s dismissal is indicative of how that worked out.
On the flip side, Manchester United rank lowest for territorial-possession against. Their system is designed to prevent their opponent’s from building pressure on their defense close to their own goal. Think of it as a system designed to prevent Phil Jones’ face from trending on Twitter. Of course, when the system breaks down and/or opposition skill breaks through, things look awful and high quality chances are conceded.
Finally, Manchester City clearly aren’t trying hard enough.
Passing maestros
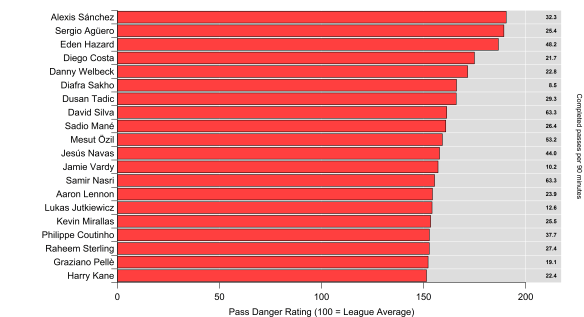
The metric I’ve devised classifies each pass completed based on the destination of the pass, so it is relatively straight-forward to breakdown the metric by the player passing the ball. Below are the top twenty players this season ranked according to the average ‘danger’ of their passes (non-headed passes only, minimum 900 minutes played). I can also do this for players receiving the ball but I’ll leave that for another time.
Players who routinely complete passes into dangerous areas will score highly here, so there is an obvious bias towards forwards and attacking midfielders/wingers. Bias will also be introduced by team systems, which would be a good thing to examine in the future. I’ve also noted on the right-hand-side the number of passes each player completes per 90 minutes to give a sense of their involvement.
Some players, like Diafra Sakho and Jamie Vardy, are rarely involved but their passes are often dangerous. Others manage to combine a high-volume of passes with danger; PFA Player of the Year, Eden Hazard, is the standout here (very much a Sum 41 kind of footballer). The link-up skills of Sánchez and Agüero are also evident.

Pass Danger Rating for English Premier League players in the 2014/15 season. Numbers on right indicate number of completed passes played per 90 minutes by each player. Minimum of 900 minutes played. Data via Opta.
I quite like this as a metric, as the results aren’t always obvious; it is nice to have confirmatory metrics but informative metrics are potentially more valuable from an analytics point of view. For instance, the metric can quickly identify the dangerous passers for the opposition, who could then be targeted to reduce their influence. It can also be useful in identifying players who could possibly do more on your own team (*cough* Lallana *cough*). Finally, it’s a metric that could be used as a part of an analytics based scouting system. I’m hoping to develop this further, so watch this space.
Pingback: Liverpool Looking Up? EPL 2015/16 Preview | 2+2=11
Pingback: Valuing Possession | 2+2=11