One of the recurring themes regarding the playing style of football teams is the idea that teams attempt to strike a balance between controlling space and controlling possession. The following quote is from this Jonathan Wilson article during the European Championships in 2012, where he discusses the spectrum between proactive and reactive approaches:
Great teams all have the same characteristic of wanting to control the pitch and the ball – Arrigo Sacchi.
No doubt there are multiple ways of defining both sides of this idea.
Controlling the ball is usually represented by possession, that is the proportion of the passes that a team plays in a single match or series of matches. If a team has the ball, then by definition, they are controlling it.
One way of defining the control of space is to think about ball possession in relation to the location of the ball on the pitch. A team that routinely possesses the ball closer to their opponents goal potentially benefits from the increased attacking opportunities that this provides, while also benefiting from the ball being far away from their own goal should they lose it.
There are certainly issues with defining control of space in this way though e.g. a well-drilled defence may be happy to see a team playing the ball high up the pitch in front of them, especially if they are adept at counter-attacking when they win the ball back.
Below is a heat map of the location of received passes in the 2013/14 English Premier League. The play is from left-to-right i.e. the team in possession is attacking towards the right-hand goal. We can see that passes are most frequently received in midfield areas, with the number of passes received decreasing quickly as we head towards each penalty area.
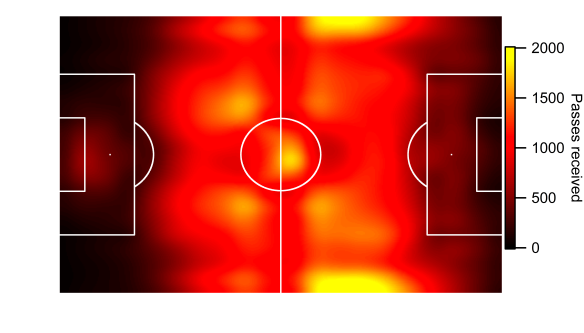
Heat map of the location of received passes in the 2013/14 English Premier League. Data via Opta.
Below is another heat map showing pass completion percentage based on the end point of the pass. The completion percentage is calculated by adding up all of the passes to a particular area on the pitch and comparing that to the number of passes that are successfully received. One thing to note here is that the end point of uncompleted passes relates to where possession was lost, as the data doesn’t know the exact target of each pass (mind-reading isn’t part of the data collection process as far as I know). That does mean that the pass completion percentage is an approximation but this is based on over 300,000 passes, so the effect is likely small.
What is very clear from the below graphic is that when within a teams own half, passes are completed routinely. The only areas where this drops are near the corner flags; I assume this is due to players either clearing the ball or playing it against an opponent when boxed into the corner.
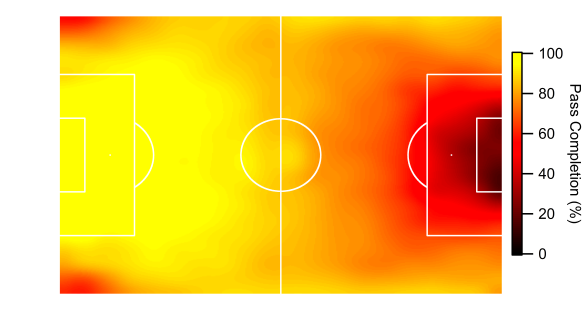
Heat map of pass completion percentage based on the target of all passes in the 2013/14 English Premier League. Data via Opta.
As teams move further into the attacking half, pass completion drops. In the central zone within the penalty area, less than half of all passes are completed and this drops to less than 20% within the six yard box. These passes within the “danger zone” are infrequent and completed far less frequently than other passes. This danger zone is frequently cited by analysts looking at shot location data as the prime zone for scoring opportunities; you would imagine that receiving passes in this zone would be beneficial.
None of the above is new. In fact, Gabe Desjardins wrote about these features using data from a previous Premier League season here and showed broadly similar results (thanks to James Grayson for highlighting his work at various points). The main thing that looks different is the number of passes played into the danger zone, I’m not sure why this is but 2012/13 and 2014/15 so far look very similar to the above in my data.
Gabe used these results to calculate a territory statistic by weighting each pass by its likelihood of being completed. He found that this measure was strongly related to success and the performance of a team.
Below is my version of territory plotted against possession for the 2013/14 Premier League season. Broadly there are four regimes in the below plot:
- Teams like Manchester City, Chelsea and Arsenal who dominate territory and have plenty of possession. These teams tend to pin teams in close to their goal.
- Teams like Everton, Liverpool and Southampton who have plenty of possession but don’t dominate territory (all there are just under a 50% share). Swansea are an extreme case in as they have lots of possession but it is concentrated in their own half where passes are easier to complete.
- Teams like West Brom and Aston Villa who have limited possession but move the ball into attacking areas when they do have it. These are quite direct teams, who don’t waste much time in their build-up play. Crystal Palace are an extreme in terms of this approach.
- Teams that have limited possession and when they do have it, they don’t have much of it in dangerous areas at the attacking end of the pitch. These teams are going nowhere, slowly.
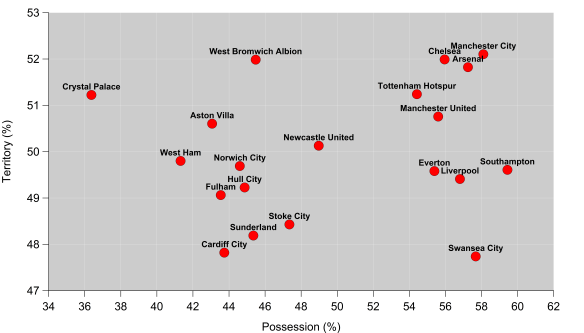
Territory percentage plotted against possession for English Premier League. Data via Opta.
Liverpool are an interesting example, as while their overall territory percentage ranks at fourteenth in the league, this didn’t prevent them moving the ball into the danger zone. For just passes received within the danger zone, they ranked third on 3.4 passes per game behind Chelsea (3.8) and Manchester City (4) and ahead of Arsenal on 2.9.
This ties in with Liverpool’s approach last season, where they would often either attack quickly when winning the ball or hold possession within their own half to try and draw teams out and open up space. Luis Suárez was crucial in this aspect, as he averaged 1.22 completed passes into the danger zone per 90 minutes. This was well ahead of Sergio Agüero in second place on 0.94 per 90 minutes.
The above is just a taster of what can be learnt from this type of data. I’ll be expanding on the above in more detail and for more leagues in the future.
