In my previous post (many moons ago), I looked at whether a players’ shot conversion in one season was a good guide to their shot conversion in the next. While there were some interesting features in this, I was wary of being too definitive given the relatively small sample size that was used. Data analysis is a journey with no end, so this is the next step. I collated the last 5 seasons of data across the top divisions in England, Spain, Germany and Italy (I drew the line at collecting France) from ESPN. An example of the data provided is available here for Liverpool in 2012/13. The last 5 seasons on ESPN are Opta provided data and matched up perfectly when I compared with English Premier League data from EPL-Index.
Before digging into the results, a few notes on the data. The data is all shots and all goals i.e. penalties are not removed. Ideally, you would strip out penalty shots and goals but that would require player-level data that I don’t have and I’ve already done enough copy and pasting. I doubt including penalties will change the story too much but it would alter the absolute numbers. Shot conversion here is defined as goals divided by total shots, where total shots includes blocked shots. I then compared shot conversion for individual players in year zero with their shot conversion the following year (year one). The initial filter that I applied here was that the player had to have scored at least one goal in both years (so as to exclude players having 0% shot conversion).
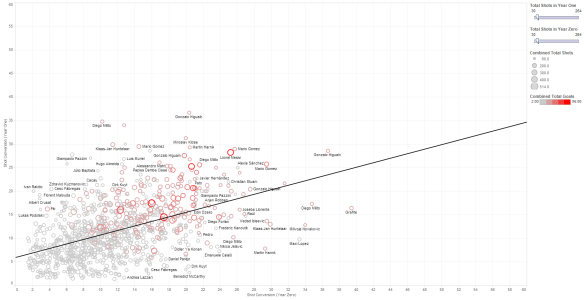
Comparison between shot conversion rates for players in year zero and the following season (year one). Click on the image or here for a larger interactive version.
Starting out with the full dataset, we have 2301 data points where a player scored a goal in two consecutive seasons. The R^2 here (a measure of the strength of the relationship) is very low, with a value of 0.061 (where zero would mean no relationship and one would be perfect). Based on the method outlined here by James Grayson, this suggests that shot conversion regresses 75% towards the mean from one season to the next. The implication of this number is that shot conversion is 25% ‘skill’ and 75% is due to random variation, which is often described as ‘luck’.
As I noted in my previous post on this subject, the attribution to skill and luck is dependent on the number of shots taken. As the number of shots increases, we smooth out some of the randomness and skill begins to emerge. A visualisation of the relationship between shot conversion and total shots is available here. Below is a summary table showing how this evolves in 10 shot increments. After around 30 shots, skill and luck are basically equal and this is maintained up to 60 shots. Above 80 shots, we seem to plateau at a 70/30% split between ‘skill’ and ‘luck’ respectively.
| Minimum Shots | Players | year-to-year r^2 | ‘luck’ | ‘skill’ |
|---|---|---|---|---|
| 1 | 2301 | 0.061 | 75% | 25% |
| 10 | 1865 | 0.128 | 64% | 36% |
| 20 | 1428 | 0.174 | 58% | 42% |
| 30 | 951 | 0.234 | 52% | 48% |
| 40 | 632 | 0.261 | 49% | 51% |
| 50 | 456 | 0.262 | 49% | 51% |
| 60 | 311 | 0.261 | 49% | 51% |
| 70 | 180 | 0.375 | 39% | 61% |
| 80 | 117 | 0.489 | 30% | 70% |
| 90 | 75 | 0.472 | 31% | 69% |
| 100 | 43 | 0.465 | 32% | 68% |
Comparison of the level of ‘skill’ and ‘luck’ attributed to scoring ability (measured by shot conversion) from one season to the next. The data is filtered by the total number of shots a player takes in consecutive seasons.
The results here are different to my previous post, where the equivalence of luck and skill was hit around 70 shots whereas it lies from 30-60 shots here. I suspect this is driven by the smaller sample size in the previous analysis. The song remains the same though; judging a player on around half a season of shots will be about as good as a coin toss. Really you want to assess a heavy shooter over at least a season with the proviso that there is still plenty of room for random variation in their shot conversion.
What is shot conversion anyway?
The past summer in the football analytics community saw a wonderful catalytic cycle of hypothesis, analysis and discussion. It’s been great to see the community feeding off each other; I would have liked to join in more but the academic conference season and the first UK heatwave in 7 years put paid to that. Much of the focus has been on shots and their outcomes. Increasingly the data is becoming more granular; soon we’ll know how many shots per game are taken within 10 yards of the corner flag at a tied game state by players with brown hair and blue eyes while their manager juggles on the sideline (corrected for strength of opposition of course). This increasing granularity is a fascinating and exciting development. While it was already clear that all shots aren’t created equal from purely watching the football, the past summer has quantified this very clearly. To me, this demonstrates that the traditional view of ‘shot conversion’ as a measure of finishing ability is erroneous.
As an illustrative example, consider two players who both take 66 shots in a season. Player A scores 11 goals, so has a shot conversion of 17%. Player B scores 2 goals, so has a shot conversion of 3%. The traditional view of shot conversion would suggest that Player A is a better finisher than Player B. However, if Player A took all of his shots from a central area within the 18-yard box, he would be bang in line with the Premier League average over the past 3 seasons. If Player B took all of his shots from outside the area, he would also be consistent with the average Premier League player. Both players are average when controlling for shot location. Clearly this is an extreme example but then again it is meant to be an illustration. To me at least, shot conversion seems more indicative of shooting efficiency i.e. taking shots from good positions under less defensive pressure will lead to an increased shot conversion percentage. Worth bearing in mind the next time someone mentions ‘best’ or ‘worst’ in combination with shot conversion.
The remaining question for me is how sustainable the more granular data is from season-to-season, especially given the smaller sample sizes.
Pingback: Luis Suárez: Home & away | 2+2=11