Originally published on StatsBomb.
The concept of pressing has existed in football for decades but its profile has been increasingly raised over recent years due to its successful application by numerous teams. Jürgen Klopp and Pep Guardiola in particular have received acclaim across their careers, with pressing seen as a vital component of their success. There are numerous other recent examples, such as the rise of Atlético Madrid, Tottenham Hotspur and Napoli under Diego Simeone, Mauricio Pochettino and Maurizio Sarri respectively.
Alongside this rise, public analytics has sought to quantify pressing through various metrics. Perhaps the most notable and widely-used example was ‘passes per defensive action’ or PPDA, which was established by Colin Trainor and first came to prominence on this very website. Anecdotally, PPDA found its way inside clubs and serves as an example of public analytics penetrating the private confines of football. Various metrics have also examined pressing through the prism of ‘possessions’, which Michael Caley has put to effective use on numerous occasions. Over the past year, I sought to illustrate pressing by quantifying a team’s ability to disrupt pass completion. While this was built on some relatively complex numerical modelling, it did provide what I thought was a nice visual representation of the effectiveness of a team’s pressing.
While the above metrics and others have their merits, they tend to ignore that pressing can take several forms and are biased towards the outcome, rather than the actual process. The one public example that side-steps many of these problems is the incredible work by the Anfield Index team through their manual collection of Liverpool’s pressing over the past few seasons but this has understandably been limited to one team.
Step-forward the new pressure event data supplied by StatsBomb Services. This new data is an event that is triggered when a player is within a five-yard radius of an opponent in possession. The radius varies as errors by the opponent would prove more costly, with a maximum range of ten-yards that is usually associated with goalkeepers under pressure. As well as logging the players involved in the pressure event and its location, the duration of the event is also collected.
The data provides an opportunity to explore pressing in greater detail than ever before. Different teams use different triggers to instigate their press, which can now be isolated and quantified. Efficiency and success can be separated from the pressing process in a number of ways at both the team and player-level. Such tools can be used in team-evaluation, opposition scouting and player recruitment.
One such application of the new data is to explore gegenpressing or counter-pressing, which is the process where a team presses the opposition immediately after losing possession. The initial aim of counter-pressing is to disrupt the opponent’s counter-attack, which can be a significant danger during the transition phase from attack-to-defence when a team is more defensively-unstable. Ideally possession is quickly won back from the opponent, with some teams seeking to exploit such situations to attack quickly upon regaining possession. Five seconds is often used as a cut-off for the period where pressure on the opposition is most intensely applied during the counter-press.
The exciting new dimension provided by StatsBomb’s new pressure data is that the definition of counter-pressing you would find in a coaching manual can be directly drawn from the data i.e. a team applies pressure to their opponent following a change in possession. The frequency at which counter-pressing occurs can be quantified and then we can develop various metrics to examine the success or failure of this process. Furthermore, we can analyse counter-pressing at the player-level, which has been out-of-reach previously.
The figure below illustrates where on the pitch counter-pressing occurs based on data from 177 matches from the Premier League this past season. The pitch is split into six horizontal zones and is orientated so that the team out-of-possession is playing from left-to-right. The colouring on the pitch shows the proportion of open-play possessions starting in each zone where pressure is applied within five seconds of a new possession.
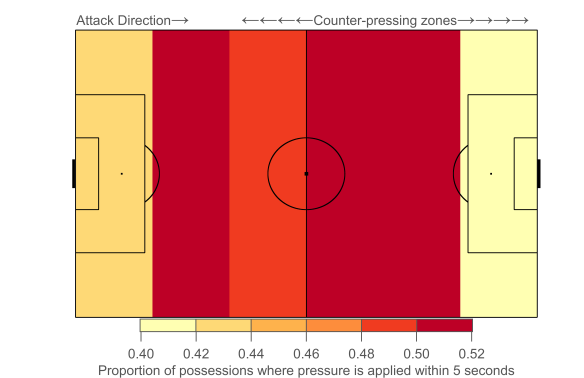
The figure illustrates that pressure is most commonly applied on possessions starting in the midfield zones, with marginally more pressure in the opposition half. Possessions beginning in the highest zone up the pitch come under less pressure, which is likely driven by the lower density of players in this zone on average. Very few possessions actually begin in the deepest zone and a smaller proportion of them come under pressure quickly than those in midfield.
From a tactical perspective, pressing is generally reserved for areas outside of a team’s own defensive third. The exact boundary will vary but for the following analysis, I have only considered possessions starting higher up the pitch, as denoted by the counter-pressing line in the previous figure.
In the figures below, the proportion of possessions in the counter-pressing zones where pressure is applied within five seconds is referred to as the ‘counter-pressing fraction’. In the sample of matches from the Premier League this season, a little under half (0.47) of open-play possessions come under pressure from their opponent within five seconds. At the top of the counter-pressing rankings, we see Manchester City, Tottenham Hotspur and Liverpool, which is unsurprising given the reputations of their managers. At the bottom end of the scale, we find a collection of teams that have mostly been overseen by British managers who are more-known for a deep-defensive line.

On the right-hand figure above, the strong association between counter-pressing and possession is illustrated, with the two showing a high correlation coefficient of 0.86 in this aggregated sample. Interpreting causality here is somewhat problematic given the likely circular relationship between the two parameters; teams that dominate possession may have more energy to press intensively, leading to a greater counter-pressing fraction, which would lead to them winning possession back more quickly, which will potentially increase their possession share and so on. The correlation is weaker for individual matches (0.36), which hints at some greater complexity and is something that can be returned to at a later date.
Perhaps the most interesting finding in the above figures is Burnley’s high counter-pressing fraction. The majority of analysis on Burnley has focused on their defensive structure within their own box and how that affects their defensive performance in relation to expected goals. The figure illustrates that Burnley employ a relatively aggressive counter-press, especially in relation to their possession share.
Examining Burnley’s counter-pressing game in more detail reveals that they counter-press 18 possessions per game, which is above average and only slightly lower than Manchester City. However, they only actually regain possession within five seconds 2.5 times per game, which falls short of what you might expect on average and falls below their counter-pressing peers. In terms of the ratio between their counter-pressing regains and total counter-pressing possessions, they sit 17th on 14%.
Burnley’s counter-press is the fourth least-effective at limiting shots, with 13% of such possessions ending with them conceding a shot compared to the average rate of 10%. However, one thing in their favour is that these possessions are typically around the league average in terms of their length and speed of attack, which will allow Burnley to regain their vaunted defensive organisation prior to conceding such shots.
The more dominant discourse around pressing is as an attacking rather than defensive weapon, so narratives are often formed around teams that regularly win back the ball through pressing and use this to generate fast attacks e.g. Liverpool and Tottenham Hotspur. As a result, a team like Burnley who seemingly employ counter-pressing as a defence-first tactic to prevent counter-attacks and slow attacking progress may be overlooked.
Burnley’s manager, Sean Dyche, has typically been lumped-in with the tactical stylings of the perennially-employed British managers who aren’t generally associated with pressing tactics. Dyche was reportedly most impressed by the pressing game employed by Guardiola’s Barcelona and he has seemingly implemented some of these ideas at Burnley. He has instilled an approach that combines counter-pressing and a low-block with numbers behind the ball, which is a neat trick to pull-off; Diego Simeone and Atlético Madrid are perhaps the more apt comparison given such traits.
The above analysis illustrates the ability of StatsBomb’s new pressure event data to illuminate an important aspect of the modern game. Furthermore, it is able to do this in a manner that directly translates tactical principles, separating underlying process and outcome, which is a giant step-forward for analytics. It also led to an analysis discussing the similarity between Guardiola’s legendary Barcelona team and Sean Dyche’s Burnley, which was probably unexpected to say the least.
This is just a taster of what is possible with StatsBomb’s new data. There’s more information in this presentation from the StatsBomb launch event and you can expect more analysis to appear over the summer and beyond.