Pressing Issues at the World Cup

Originally published on StatsBomb.

One of the tactical questions heading into the World Cup was whether the modern popularity of pressing at club level would be replicated on the international stage. The best pressing teams are a meld of intelligent positioning and trigger movements, honed during hours on the training pitch, requiring intense and sustained athletic performance.

Such luxuries are not afforded to international teams, who have far less training time to drill such tactics, coupled with many players arriving at the tournament after long club seasons. A heatwave encompassing much of Europe, including many of the west Russian venues, presents another potential barrier to intense pressing at the tournament.

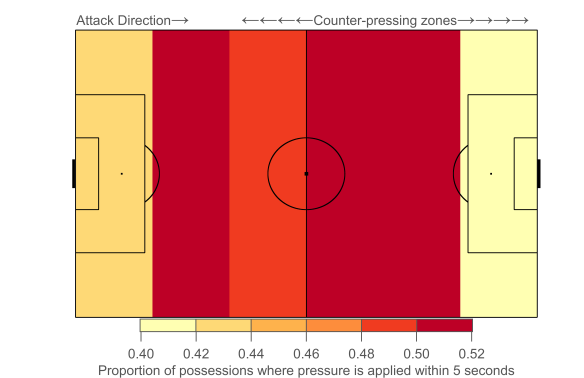
Gegenpressing or counter-pressing is one form of pressing, where a team presses the opposition immediately after losing possession, with the initial aim being to disrupt the opponent’s transition phase and potential counter-attack. Across the English Premier League last season, 46% of open-play possessions were pressed within 5 seconds, with the trio of Spurs, Liverpool and Manchester City leading the league with a counter-pressing fraction of close to 60%. At the other end of the scale was Stoke City and West Brom at around 35%.

Perhaps surprisingly, the counter-pressing rate at the World Cup through the group stage and last-sixteen stands at 59%. There are a number of contextual factors to these figures that partially explain this difference. Note the absolute figures below are per game per team.

Firstly there have been slightly fewer open-play possessions available to counter-press at the World Cup (33) than in the EPL (35); fewer open-play possessions potentially means that teams are able to maintain a higher intensity, which would shift the observed counter-pressing fractions. This is borne out in the average number of counter-pressed possessions, which stands at 19 possessions in the World Cup compared to 16 possessions in the EPL.

Secondly there is a significant stylistic contrast between the EPL and World Cup in terms of passing, with 66 long balls per game in the former and 59 per game in the latter. Conversely, short passes are greater (398 per game) at the World Cup than in the past EPL season (392). The greater propensity towards long balls in the EPL, especially early on in a possession, cuts down on opportunities to counter-press, while a lower number of shorter passes will act in a similar manner.

The third factor is the differing priorities and incentives of a World Cup group stage and a 38-game season. The figure below illustrates the importance of considering the small sample size at play in the World Cup and how a team’s approach will vary from game-to-game. Each team is ranked according to their average counter-pressing percentage, with their individual matches shown to illustrate the variation across the tournament. This variation is further summarized in the right-hand figure, where the standard deviation across their matches is shown as the horizontal lines around each data point (broader lines mean a greater standard deviation and thus more variation).

World-Cup-Counter-Pressing-Smaller

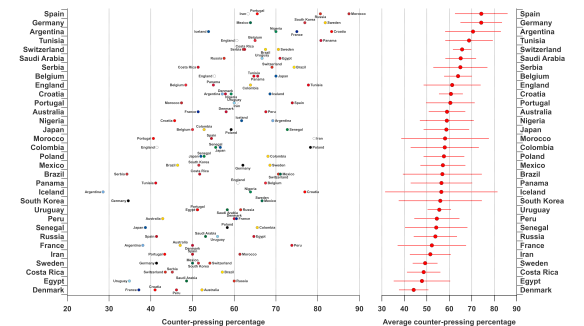
Iceland are perhaps the best example of how a group stage spanning three matches shapes tactical considerations and can lead to misleading averages – in their first match against Argentina, they registered the lowest counter-pressing percentage of the tournament as they were happy to get players behind the ball and concentrate on frustrating their opponent’s efforts in the final third. A draw against the perceived giant of the group was a good result on their World Cup debut but subsequent matches would require them to force the issue more in search of a win to place them in a good position to advance; their counter-pressing percentage increased in their subsequent matches culminating in a very high counter-pressing rate against Croatia with a win needed for qualification from the group stage.

Contrast this with a team in the EPL that is uninclined to counter-press, such as West Brom, when playing against more favoured opponents – three draws or perhaps a narrow fortuitous win would often be a more than satisfactory outcome, so sitting deep and frustrating the opposition is a sensible strategy. Such considerations apply at the other end of the scale also e.g. taking a small sample of matches against a minnow sitting deep in their own half from Spurs’ season when chasing a win would yield a selection of matches where they aggressively counter-pressed their opponent. This latter example likely explains the very high counter-pressing rate by the likes of Germany, Spain and Argentina as they found themselves in close matches where they needed to push for a win.

This isn’t to say that the tactical approach of all teams at the World Cup is dictated more by game-state and qualification permutations – of the teams remaining Sweden, Uruguay, Croatia and Belgium have been quite consistent across the tournament and are perhaps more likely to employ their preferred counter-pressing intensity in their remaining matches. On the other side of the coin, Brazil, France and England have been more variable with Russia sat in the middle.

Pressing outcomes

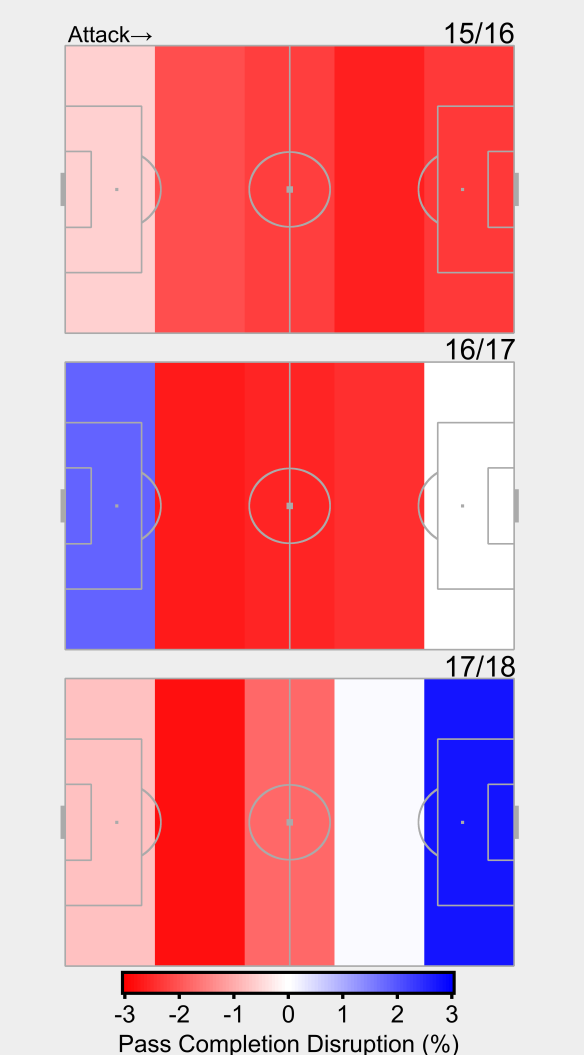
In terms of evaluating successful counter-pressing, the gap between the EPL and World Cup is less obvious – 17% of counter-pressing possessions have seen possession won or disrupted within 5 seconds in the World Cup, which is only 1% greater than in the EPL. In both the EPL and World Cup, 10% of counter-pressing possessions have ended with a shot for the team being pressed, which results in an increased absolute rate (1.9 shots per game) in the World Cup compared to the EPL (1.6 per game).

In the EPL, the most aggressive counter-pressing teams tend to also routinely win possession back and concede fewer shots during this phase (Manchester City top the rankings in both categories, with Liverpool not too far behind and Spurs performing at an above average level). Such figures are likely noisier during the World Cup given the small sample size with the trend being similar albeit less strong, with Spain and Argentina performing well in terms of disrupting possession, while being closer to average in terms of conceding shots from counter-pressing possessions.

Many words have been and will continue to be expounded on Germany’s woes at this tournament, but their figures here merit a mention before turning to teams still in the World Cup. They were below average in terms of regaining possession, with a particularly woeful and damaging performance against Mexico. Toni Kroos was the thankless leader of Germany’s counter-press with Mats Hummels and Jérôme Boateng being the next most frequent counter-pressers, which seems shall we say sub-optimal and flies in the face of how other counter-pressing teams profile. Furthermore, 15% of the possessions they counter-pressed ended with their opponent taking a shot, tied for fourth-worst in the tournament. They were also tied for fourth-worst in terms of the number of shots conceded from counter-pressing possessions. Such figures are likely flattering given some of the counter-attacking opportunities wasted by Mexico and South Korea. Vulnerability isn’t a word usually associated with the German national team but that is what they were – yes, they were somewhat unfortunate to score only two goals while finishing bottom of their group but their struggles in defensive transition could have been even more disastrous against better opposition in the knock-out stages. Winning the World Cup is obviously Brazil’s priority but if they were ever going to avenge the 7-1 loss in 2014, then a last-16 clash against this German team would have been their chance.

Quarter-final notes

Uruguay vs France: neither team has been committed to counter-pressing during the tournament so far. When Uruguay have pressed, they haven’t typically regained possession quickly but they have been excellent at slowing down attacks and preventing shots. France have matched them in terms of shot-suppression, which suggests that the decisive moments will come from other angles.

Brazil vs Belgium: Brazil have sought to counter-press their opponents in their most crucial and more-even matches (vs Switzerland and Mexico), so may well aim for a similar strategy against Belgium. Discounting Belgium’s encounter with England (sorry Adnan) suggests they will also seek to put pressure on Brazil during transitions, which indicates the match will be keenly contested when possession is lost. Both teams looked somewhat vulnerable to counter-attacks during their round-of-16 matches and with each of them containing some of the best counter-attacking passers and finishers around, shutting-down or exploiting such opportunities could be key.

Sweden vs England: Sweden sit at the low end of the scale in terms of counter-pressing and have applied such tactics consistently across the tournament. Given their success across qualifying and at this tournament, we shouldn’t expect a deviation from this at the quarter-final stage. England employed an aggressive counter-press against Tunisia in their opener, followed by a drop off against Panama after running up an early lead, while the Belgium game is best forgotten (sorry Adnan). Their match against Colombia saw a return to more of a counter-pressing style, although not at the same level as against Tunisia. In summary, England have been more aggressive during transitions when they’ve had the most riding on their matches and have dominated possession, so expect them to utilize such tactics against Sweden.

Russia vs Croatia: the hosts have generally employed a less aggressive counter-press than their peers, with their lowest rate coming against Spain in the round-of-16. It will be interesting to see if they alter their approach against another technically gifted side. Croatia have counter-pressed at an average rate and at a quite consistent level, so it will be intriguing to see if they contest turn-overs or invite Russia onto them more with the intention of drawing them out of their defensive third.

Pressing has been a perhaps surprising feature of this World Cup and contributed to the narratives around several teams, whether they be success stories or futile failures. Come the 15th of July, we’ll see how much of a role it has played in the denouement of this wonderful World Cup.

Advertisement

Measuring counter-pressing

Originally published on StatsBomb.

The concept of pressing has existed in football for decades but its profile has been increasingly raised over recent years due to its successful application by numerous teams. Jürgen Klopp and Pep Guardiola in particular have received acclaim across their careers, with pressing seen as a vital component of their success. There are numerous other recent examples, such as the rise of Atlético Madrid, Tottenham Hotspur and Napoli under Diego Simeone, Mauricio Pochettino and Maurizio Sarri respectively.

Alongside this rise, public analytics has sought to quantify pressing through various metrics. Perhaps the most notable and widely-used example was ‘passes per defensive action’ or PPDA, which was established by Colin Trainor and first came to prominence on this very website. Anecdotally, PPDA found its way inside clubs and serves as an example of public analytics penetrating the private confines of football. Various metrics have also examined pressing through the prism of ‘possessions’, which Michael Caley has put to effective use on numerous occasions. Over the past year, I sought to illustrate pressing by quantifying a team’s ability to disrupt pass completion. While this was built on some relatively complex numerical modelling, it did provide what I thought was a nice visual representation of the effectiveness of a team’s pressing.

While the above metrics and others have their merits, they tend to ignore that pressing can take several forms and are biased towards the outcome, rather than the actual process. The one public example that side-steps many of these problems is the incredible work by the Anfield Index team through their manual collection of Liverpool’s pressing over the past few seasons but this has understandably been limited to one team.

Step-forward the new pressure event data supplied by StatsBomb Services. This new data is an event that is triggered when a player is within a five-yard radius of an opponent in possession. The radius varies as errors by the opponent would prove more costly, with a maximum range of ten-yards that is usually associated with goalkeepers under pressure. As well as logging the players involved in the pressure event and its location, the duration of the event is also collected.

The data provides an opportunity to explore pressing in greater detail than ever before. Different teams use different triggers to instigate their press, which can now be isolated and quantified. Efficiency and success can be separated from the pressing process in a number of ways at both the team and player-level. Such tools can be used in team-evaluation, opposition scouting and player recruitment.

One such application of the new data is to explore gegenpressing or counter-pressing, which is the process where a team presses the opposition immediately after losing possession. The initial aim of counter-pressing is to disrupt the opponent’s counter-attack, which can be a significant danger during the transition phase from attack-to-defence when a team is more defensively-unstable. Ideally possession is quickly won back from the opponent, with some teams seeking to exploit such situations to attack quickly upon regaining possession. Five seconds is often used as a cut-off for the period where pressure on the opposition is most intensely applied during the counter-press.

The exciting new dimension provided by StatsBomb’s new pressure data is that the definition of counter-pressing you would find in a coaching manual can be directly drawn from the data i.e. a team applies pressure to their opponent following a change in possession. The frequency at which counter-pressing occurs can be quantified and then we can develop various metrics to examine the success or failure of this process. Furthermore, we can analyse counter-pressing at the player-level, which has been out-of-reach previously.

The figure below illustrates where on the pitch counter-pressing occurs based on data from 177 matches from the Premier League this past season. The pitch is split into six horizontal zones and is orientated so that the team out-of-possession is playing from left-to-right. The colouring on the pitch shows the proportion of open-play possessions starting in each zone where pressure is applied within five seconds of a new possession.

AvgCounterPressMap.png

The figure illustrates that pressure is most commonly applied on possessions starting in the midfield zones, with marginally more pressure in the opposition half. Possessions beginning in the highest zone up the pitch come under less pressure, which is likely driven by the lower density of players in this zone on average. Very few possessions actually begin in the deepest zone and a smaller proportion of them come under pressure quickly than those in midfield.

From a tactical perspective, pressing is generally reserved for areas outside of a team’s own defensive third. The exact boundary will vary but for the following analysis, I have only considered possessions starting higher up the pitch, as denoted by the counter-pressing line in the previous figure.

In the figures below, the proportion of possessions in the counter-pressing zones where pressure is applied within five seconds is referred to as the ‘counter-pressing fraction’. In the sample of matches from the Premier League this season, a little under half (0.47) of open-play possessions come under pressure from their opponent within five seconds. At the top of the counter-pressing rankings, we see Manchester City, Tottenham Hotspur and Liverpool, which is unsurprising given the reputations of their managers. At the bottom end of the scale, we find a collection of teams that have mostly been overseen by British managers who are more-known for a deep-defensive line.

Team_CounterPressFraction

On the right-hand figure above, the strong association between counter-pressing and possession is illustrated, with the two showing a high correlation coefficient of 0.86 in this aggregated sample. Interpreting causality here is somewhat problematic given the likely circular relationship between the two parameters; teams that dominate possession may have more energy to press intensively, leading to a greater counter-pressing fraction, which would lead to them winning possession back more quickly, which will potentially increase their possession share and so on. The correlation is weaker for individual matches (0.36), which hints at some greater complexity and is something that can be returned to at a later date.

Perhaps the most interesting finding in the above figures is Burnley’s high counter-pressing fraction. The majority of analysis on Burnley has focused on their defensive structure within their own box and how that affects their defensive performance in relation to expected goals. The figure illustrates that Burnley employ a relatively aggressive counter-press, especially in relation to their possession share.

Examining Burnley’s counter-pressing game in more detail reveals that they counter-press 18 possessions per game, which is above average and only slightly lower than Manchester City. However, they only actually regain possession within five seconds 2.5 times per game, which falls short of what you might expect on average and falls below their counter-pressing peers. In terms of the ratio between their counter-pressing regains and total counter-pressing possessions, they sit 17th on 14%.

Burnley’s counter-press is the fourth least-effective at limiting shots, with 13% of such possessions ending with them conceding a shot compared to the average rate of 10%. However, one thing in their favour is that these possessions are typically around the league average in terms of their length and speed of attack, which will allow Burnley to regain their vaunted defensive organisation prior to conceding such shots.

The more dominant discourse around pressing is as an attacking rather than defensive weapon, so narratives are often formed around teams that regularly win back the ball through pressing and use this to generate fast attacks e.g. Liverpool and Tottenham Hotspur. As a result, a team like Burnley who seemingly employ counter-pressing as a defence-first tactic to prevent counter-attacks and slow attacking progress may be overlooked.

Burnley’s manager, Sean Dyche, has typically been lumped-in with the tactical stylings of the perennially-employed British managers who aren’t generally associated with pressing tactics. Dyche was reportedly most impressed by the pressing game employed by Guardiola’s Barcelona and he has seemingly implemented some of these ideas at Burnley. He has instilled an approach that combines counter-pressing and a low-block with numbers behind the ball, which is a neat trick to pull-off; Diego Simeone and Atlético Madrid are perhaps the more apt comparison given such traits.

The above analysis illustrates the ability of StatsBomb’s new pressure event data to illuminate an important aspect of the modern game. Furthermore, it is able to do this in a manner that directly translates tactical principles, separating underlying process and outcome, which is a giant step-forward for analytics. It also led to an analysis discussing the similarity between Guardiola’s legendary Barcelona team and Sean Dyche’s Burnley, which was probably unexpected to say the least.

This is just a taster of what is possible with StatsBomb’s new data. There’s more information in this presentation from the StatsBomb launch event and you can expect more analysis to appear over the summer and beyond.

What has happened to the Klopp press?

Originally published on StatsBomb.

When asked how his Liverpool team would play by the media horde who greeted his unveiling as manager two years ago, Jürgen Klopp responded:

We will conquer the ball, yeah, each fucking time! We will chase the ball, we will run more, fight more.

The above is a neat synopsis of Klopp’s preferred style of play, which focuses on pressing the opponent after losing the ball and quickly transitioning into attack. It is a tactic that he successfully deployed at Borussia Dortmund and one that he has employed regularly at Liverpool.

However, a noticeable aspect of the new season has been Liverpool seemingly employing a less feverish press. The Anfield Index Under Pressure Podcast led the way with their analysis, which was followed by The Times’ Jonathan Northcroft writing about it here and Sam McGuire for Football Whispers.

Liverpool’s pass disruption map for the past three seasons is shown below. Red signifies more disruption (greater pressure), while blue indicates less disruption (less pressure). In the 2015/16 and 2016/17 seasons, the team pressed effectively high up the pitch but that has slid so far this season to a significant extent. There is some disruption in the midfield zone but at a lower level than previously.

LFC_dxP.png

Liverpool’s zonal pass completion disruption across the past three seasons. Teams are attacking from left-to-right, so defensive zones are to the left of each plot. Data via Opta.

The above numbers are corroborated by the length of Liverpool’s opponent possessions increasing by approximately 10% this season compared to the rest of Klopp’s reign. Their opponents so far this season have an average possession length of 6.5 seconds, which is lower than the league average but contrasts strongly with the previous figures that have been among the shortest in the league.

Examining their pass disruption figures game-by-game reveals further the reduced pressure that Liverpool are putting on their opponents. During 2015/16 and 2016/17, their average disruption value was around -2.5%, which they’ve only surpassed once in Premier League matches this season, with the average standing at -0.66%.

LFC-xP-17-18

Liverpool’s game-by-game pass completion disruption for 2017/18 English Premier League season. Figures are calculated for zones above Opta x-coordinates greater than 40. Data via Opta.

The Leicester match is the major outlier and examining their passing further indicates that the high pass disruption was a consequence of them attempting a lot of failed long passes. This is a common response to Liverpool’s press as teams go long to bypass the pressure.

Liverpool’s diminished press is likely a deliberate tactic that is driven by the added Champions League matches the team has faced so far this season. The slightly worrisome aspect of this tactical shift is that Liverpool’s defensive numbers have taken a hit.

In open-play, Liverpool’s expected goals against figure is 0.81 per game, which is up from 0.62 last season. Furthermore, their expected goals per shot has risen to 0.13 from 0.11 in open-play. To add further defensive misery, Liverpool’s set-piece woes (specifically corners) have actually got worse this season. The team currently sit eleventh in expected goals conceded this season, which is a fall from fifth last year.

This decline in underlying defensive performance has at least been offset by a rise on the attacking side of 0.4 expected goals per game to 1.78 this season. Overall, their expected goal difference of 0.79 this season almost exactly matches the 0.81 of last season.

Liverpool’s major problem last season was their soft under-belly but they were often able to count on their pressing game denying their opponents opportunities to exploit it. What seems to be happening this season is that the deficiencies at the back are being exploited more with the reduced pressure ahead of them.

With the season still being relatively fresh, the alarm bells shouldn’t be ringing too loudly but there is at least cause for concern in the numbers. As ever, the delicate balancing act between maximising the sides attacking output while protecting the defense is the key.

Klopp will be searching for home-grown solutions in the near-term and a return to the familiar pressing game may be one avenue. Given the competition at the top of the table, he’ll need to find a solution sooner rather than later, lest they be left behind.