Goalkeepers have typically been a tough nut to crack from a data analytics point-of-view. Randomness is an inherent aspect of goal-scoring, particularly over small samples, which makes drawing robust conclusions at best challenging and at worst foolhardy. Are we identifying skill in our ratings or are we just being sent down the proverbial garden path by variance?
To investigate some of these issues, I’ve built an expected save model that takes into account shot location and angle, whether the shot is a header or not and shot placement. So a shot taken centrally in the penalty area sailing into the top-corner will be unlikely to be saved, while a long-range shot straight at the keeper in the centre of goal should usually prove easier to handle.
The model is built using data from the past four seasons of the English, Spanish, German and Italian top leagues. Penalties are excluded from the analysis.
Similar models have been created by new Roma analytics guru, Stephen McCarthy, Colin Trainor & Constantinos Chappas and Thom Lawrence in the past.
The model thus provides an expected goal value for each shot that a goalkeeper faces, which we can then compare with the actual outcome. In a simpler world, we could easily identify shot-stopping skill by taking the difference between reality and expectation and then ranking goalkeepers by who has the best (or worst) difference.
However, this isn’t a simple world, so we run into problems like those illustrated in the graphic below.
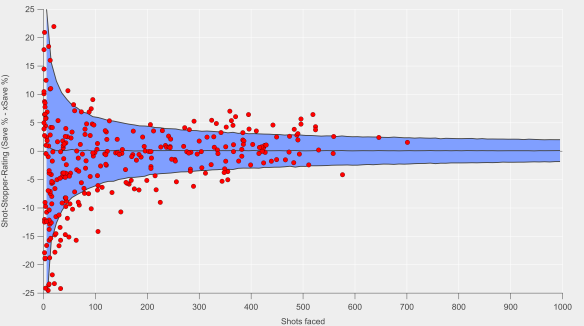
Shot-stopper-rating (actual save percentage minus expected save percentage) versus number of shots faced. The central black line at approximately zero is the median, while the blue shaded region denotes the 90% confidence interval. Red markers are individual players. Data via Opta.
Each individual red marker is a player’s shot-stopper rating over the past four seasons versus the number of shots they’ve faced. We see that for low shot totals, there is a huge range in the shot-stopper-ranking but that the spread decreases as the number of shots increases, which is an example of regression to the mean.
To illustrate this further, I used a technique called boot-strapping to re-sample the data and generate confidence intervals for an average goalkeeper. This re-sampling is done 10,000 times to create a probability distribution built by randomly extracting groups of shots from the data-set and calculating actual and expected save percentages and then seeing how large the difference is. We see a strong narrowing of the blue uncertainty envelope up to around 50 shots, with further narrowing up to about 200 shots. After this, the narrowing is less steep.
What this effectively means is that there is a large band of possible outcomes that we can’t realistically separate from noise for an average goalkeeper. Over a season, a goalkeeper faces a little over 100 shots on target (119 on average according to the data used here). Thus, there is a huge opportunity for randomness to play a role and it is therefore of little surprise to find that there is little repeatability year-on-year for save percentage.
Things do start to settle down as shot totals increase though. After 200 shots, a goalkeeper would need to be performing more than ± 4% on the shot-stopper-rating scale to stand up to a reasonable level of statistical significance. After 400 shots, signal is easier to discern with a keeper needing to register more than ± 2% to emerge from the noise. That is not to say that we should be beholden to statistical significance but it is certainly worth bearing in mind in any assessment plus an understanding of the uncertainty inherent in analytics can be a powerful weapon to wield.
What we do see in the graphic above are many goalkeepers outside of the blue uncertainty envelope. This suggests that we might be able to identify keepers who are performing better or worse than the average goalkeeper, which would be pretty handy for player assessment purposes. Luckily, we can employ some more maths courtesy of Pete Owen who presented a binomial method to rank shot-stopping performance in a series of posts available here and here.
The table below lists the top-10 goalkeepers who have faced more than 200 shots over the past four seasons by the binomial ranking method.
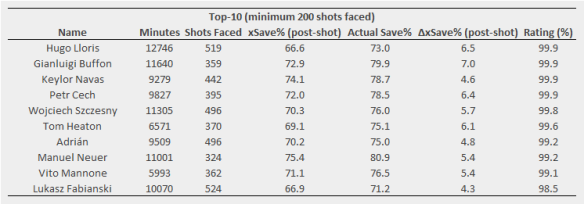
Top-10 goalkeepers as ranked by their binomial shot-stopper-ranking. Post-shot refers to expected save model that accounts for shot placement. Data via Opta.
I don’t know about you but that doesn’t look like too shabby a list of the top keepers. It may be that some of the names on the list have serious flaws in their game aside from shot-stopping but that will have to wait another day and another analysis.
So where does that leave us in terms of goalkeeping analytics? On one hand, we have noisy unrepeatable metrics from season-to-season. On the other, we appear to have some methods available to extract the signal from the noise over larger samples. Even then, we might be being fooled by aspects not included in the model or the simple fact that we expect to observe outliers.
Deficiencies in the model are likely our primary concern but these should be checked by a skilled eye and video clips, which should already be part of the review process (quit sniggering at the back there). Consequently, the risks ingrained in using an imperfect model can be at least partially mitigated against.
Requiring 2-3 seasons of data to get a truly robust view on shot-stopping ability may be too long in some cases. However, perhaps we can afford to take a longer-term view for such an important position that doesn’t typically see too much turnover of personnel compared to other positions. The level of confidence you might want when short-listing might well depend on the situation at hand; perhaps an 80% chance of your target being an above average shot-stopper would be palatable in some cases?
All this is to say that I think you can assess goalkeepers by the saves they do or do not make. You just need to be willing to embrace a little uncertainty in the process.
Pingback: More thinking about goalkeepers | 2+2=11
Pingback: Liverpool 2017/18 season preview | 2+2=11