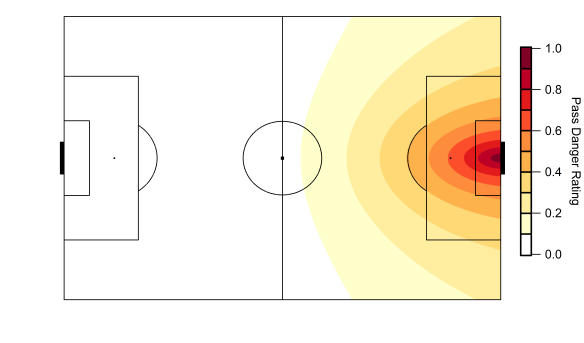
In my previous post, I described my possession danger rating model, which classifies attacks according to their proximity to goal and their relative occurrence compared to other areas of the pitch. Each possession sequence in open-play is assigned a value depending on where it ends. The figure below outlines the model, with possession sequences ending closer to goal given more credit than those that break down further away.

Map of the pass weighting model based on data from the English Premier League. Data via Opta.
Instead of just looking at this metric at the team level, there are numerous ways of breaking it down to the player level.
For each possession, a player could be involved in numerous ways e.g. winning the ball back via a tackle, a successful pass or cross, a dribble past an opponent or a shot at goal. Players that are involved in more dangerous possessions may be more valuable, particularly when we compare them to their peers. When viewing teams, we may identify weak links who reduce the effectiveness of an attack. Conversely, we can pick out the stars in a team or indeed the league.
Networking
One popular method of analysing the influence of players on a team is network analysis. This is something I’ve used in the past to examine how a team plays and who the crucial members of a team are. It looks at who a player passes the ball to and who they receive passes from, with players with many links to their teammates usually rated more highly. For example, a midfield playmaker who provides the link between a defence and attack will often score more highly than a centre back who mainly receives passes from their goalkeeper and then plays a simple pass to their central defensive partner.
In order to assess the influence of players on attacking possessions, I’ve combined the possession danger rating model with network analysis. This adjusts the network analysis to give more credit to players involved in more dangerous attacks, while also allowing us to identify the most influential members of a team.
Below is an example network for Liverpool last season during a 10 match period where they mainly played in a 3-4-3 formation. The most used eleven players during this period are shown according to their average position, with links between each player coloured according to how dangerous the possessions these links contributed to were.
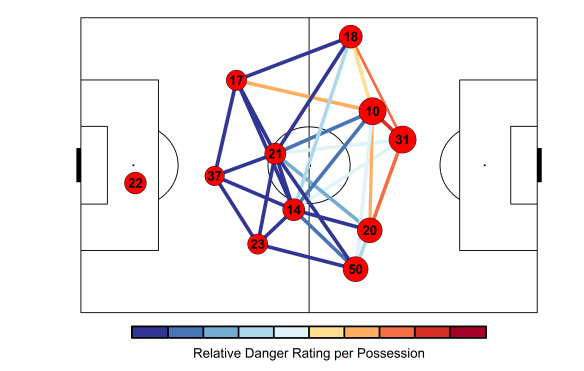
Possession network for Liverpool for the ten matches from Swansea City (home) to Burnley (home) during the 2014/15 season. Lines are coloured according to the relative danger rating per each possession between each player. Player markers are sized by their adjusted closeness centrality score (see below). Data via Opta.
Philippe Coutinho (10) was often a crucial cog in the network as he linked up with many of his team mates and the possessions he was involved with were often dangerous. His links with Sakho (17) and Moreno (18) appears to have been a fruitful avenue for attacks – this is an area we could examine in more detail via both data and video analysis if we were scouting Liverpool’s play. Over the whole season, Coutinho was easily the most crucial link in the team, which will come as no surprise to anyone who watched Liverpool last season.
Making the play
We can go further than players on a single team and compare across the entire league last season. To do this, I’ve calculated each players ‘closeness centrality‘ score or player influence score but scaled it according to how dangerous the possessions they were involved in were over the season. The rating is predominantly determined by how many possessions they are involved in, how well they link with team mates and the danger rating of the possessions they contribute to.
Yaya Touré leads the league by some distance due to him essentially being the crucial cog in the best attack in the league last season. Many of the players on the list aren’t too surprising, with a collection of Arsenal and Manchester City players high on the list plus the likes of Coutinho and Hazard also featuring.
The ability to effectively dictate play and provide a link for your team mates is likely desirable but the level of involvement a player has may be strongly governed by team tactics and their position on the field. One way around this is to control for the number of possessions a player is involved in to separate this out from the rating; Devin Pleuler made a similar adjustment in this Central Winger post.
Below are the top twenty players from last season according to this adjusted rating, which I’m going to refer to as an ‘influence rating’.

Top twenty players (minimum 1800 minutes) per the adjusted influence rating for the 2014/15 Premier League season. The number of completed passes each player made per 90 minutes is shown on the left. Data via Opta.
When accounting for their level of involvement, Mesut Özil rises to the top, narrowly ahead of Santi Cazorla and Yaya Touré. While players such as these don’t lead the league in terms of the most dangerous passes in open-play, they appear to be crucial conduits for their respective attacks. That might entail choosing the best options to facilitate attacks, making space for their team mates or playing a crucial line-breaking pass to open up a defence or all of the above and more.
There are some surprising names on the list, not least the Burnley duo of Danny Ings and George Boyd! Their level of involvement was very low (the lowest of those in the chart above) but when they were involved, Burnley created quite dangerous attacks and they linked well with the rest of the team. Burnley had a reasonably decent attack last season based on their underlying numbers but they massively under-performed when it came to actual goals scored. The question here is would this level of influence be maintained in a different setup and with greater involvement?
Ross Barkley is perhaps another surprising inclusion given his reputation outside of those who depict him as the latest saviour of English football. Looking at his passing chart and links, this possibly points to the model not accounting for crossing often being a less effective method of attack; his passing chart in the final third is biased towards passes to wide areas, which often then results in a cross into the box. Something for version 2.0 to explore. He was Everton’s attacking hub player, which perhaps helps to explain their lack of penetration in attack last season.
Conclusion
The above is just one example of breaking down my dangerous possession metric to the player level. As with all metrics, it could certainly be improved e.g. additional measures of quality of possession could be included and I’m aware that there are likely issues with team effects inflating or deflating certain players. Rating across all players isn’t completely fair, as there is an obvious bias towards attack-minded players, so I will look to break it down across player positions and roles.
Stay tuned for future developments.