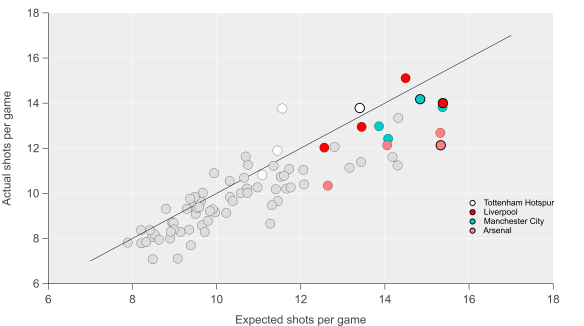
The narrative surrounding Arsenal has been strong this week, with their fall to fourth place in the table coming on Groundhog Day no less. This came despite a strong second half showing against Southampton, with Fraser Forster denying them. Arsenal’s season has been characterised by several excellent performances in terms of expected goals but the scoreline hasn’t always reflected their statistical dominance. Colin Trainor illustrated their travails in front of goal in this tweet.
I wrote in this post on how Arsenal’s patient approach eschews more speculative shots in search of high quality chances and that this was seemingly more pronounced this season. Arsenal are highly rated by expected goal models this season but traditional shot metrics are nowhere near as convinced.
Analytical folk will point to the high quality of Arsenal’s shots this season to explain the difference, where quality is denoted by the average probability that a shot will be scored. For example, a team with an average shot quality of 0.10 would ‘expect’ to score around 10% of their shots taken.
In the chart below, I’ve looked at the full distribution of Arsenal’s shots in open-play this season in terms of ‘shot quality’ and compared them with their previous incarnations and peers from the 2012/13 season through to the present. Looking at shot quality in this manner illustrates that the majority of shots are of relatively low quality (less than 10% chance of being scored) and that the distribution is heavily-skewed.

Proportion of total shots in open-play according to the probability of them being scored (expected goals per shot). Grey lines are non-Arsenal teams from the English Premier League from 2012/13 to the present. Blue lines are previous Arsenal teams, while red is Arsenal from this season. Data via Opta.
In terms of Arsenal, what stands out here is that their current incarnation are taking a smaller proportion of ‘low-quality’ shots (those with an expected goal estimate from 0-0.1) than any previous team by a fairly wide margin. At present, 59% of Arsenal’s shots reside in this bracket, with the next lowest sitting at 64%. Their absolute number of shots in this bracket has also fallen compared to previous seasons.
Moving along the scale, Arsenal reside along the upper edge in terms of these higher quality shots and actually have the largest proportion in the 0.2-0.3 and 0.3-0.4 ranges. As you would expect, they’ve traded higher quality shots for lower quality efforts according to the data.
Arsenal typically post above average shot quality figures but the shift this season appears to be significant. The question is why?
Mesut Özil?
One big change this season is the sustained presence (and excellence) of Mesut Özil; so far this season he has made 22 appearances (playing in 88% of available minutes) compared to 22 appearances last season (54%) and 26 matches in his debut season (63%). According to numbers from the Football in the Clouds website, his contribution to Arsenal’s shots while he is on the pitch is at 40% compared to 30% in 2014/15. Daniel Altman also illustrated Özil’s growing influence in his post in December.
Özil is the star that Arsenal’s band of attacking talent orbits, so it is possible that he is driving this focus on quality via his creative skills. His attacking contribution in terms of shots and shot-assists is among the highest in the league but is heavily-skewed towards assisting others, which is unusual among high-volume contributors.
Looking at the two previous seasons though, there doesn’t appear to be any great shift in Arsenal’s shot quality during the periods when Özil was out of the team through injury. His greater influence and regular presence in the side this season has probably shifted the dial but quantifying how much would require further analysis.
Analytics?
Another potential driver could be that Wenger and his coaching staff have attempted to adjust Arsenal’s tactics/style with a greater focus on quality.
Below is a table of Arsenal’s ‘volume’ shooters over the past few seasons, where I’ve listed their number of shots from outside of the box per 90 minutes and the proportion of their shots from outside the box. Note that these are for all shots, so set-pieces are included but it shouldn’t skew the story too much.
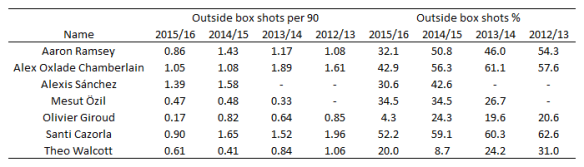 The general trend is that Arsenal’s players have been taking fewer shots from outside of the box this season compared to previous and that there has been a decline proportionally for most players also. Some of that may be driven by changing roles/positions in the team but there appears to be a clear shift in their shot profiles. Giroud for example has taken just 3 shots from outside the box this season, which is in stark contrast to his previous profile.
Given the data I’ve already outlined, the above isn’t unexpected but then we’re back to the question of why?
Wenger has mentioned expected goals on a few occasions now and has reportedly been working more closely with the analytics team that Arsenal acquired in 2012. Given his history and reputation, we can be relatively sure that Wenger would appreciate the merits of shot quality; could the closer working relationship and trust developed with the analytics team have led to him placing an even greater emphasis on seeking better shooting opportunities?
The above is just a theory but the shift in emphasis does appear to be significant and is an interesting feature to ponder.
Adjusted expectations?
Whatever has driven this shift in Arsenal’s shot profile, the change is quite pronounced. From an opposition strategy perspective, this presents an interesting question: if you’re aware of this shift in emphasis, whether through video analysis or data, do you alter your defensive strategy accordingly?
While Arsenal’s under-performance in terms of goals versus expected goals currently looks like a case of variance biting hard, could this be prolonged if their opponents adjust? It doesn’t look like their opponents have altered tactics thus far based on examining the data but having shifted the goalposts in terms of shot quality, could this be their undoing?