Originally published on StatsBomb.
After the sordid love affair that culminated in a strong title challenge in 2013/14, Liverpool barely cast a furtive glance at the Champions League places in 2014/15. Their underlying numbers over the whole season provided scant consolation either, with performance levels in line with a decent team lacking the quality usually associated with a top-four contender. Improvements in results and underlying performance will therefore be required to meet the club’s stated aim of Champions League football.
Progress before a fall
Before looking forward to the coming season, let’s start with a look back at Liverpool’s performance over recent seasons. Below is a graphic showing Liverpool’s underlying numbers over the past five seasons, courtesy of Paul Riley’s Expected Goal numbers.

Expected goal rank over the past 5 seasons of the English Premier League. Liverpool seasons highlighted in red.
From 2010/11 to 2012/13, there was steady progress with an impressive jump in 2013/14 to the third highest rating over the past five years. Paul’s model only evaluates shots on target, so Liverpool’s 2013/14 rating is potentially biased a little high given their unusual/unsustainable proportion of shots on target that year. However, the quality was clear, particularly in attack. Not to be outdone, 2014/15 saw another impressive jump but unfortunately the trajectory was in the opposite direction. Other metrics such as total shots ratio and shots on target ratio tell a similar story, although 2013/14 isn’t quite as impressive.
The less charitable among you may ascribe Liverpool’s trajectory with the presence and performance of one Luis Suárez; when joining in January 2010, Suárez was an erratic yet gifted performer who went on to become a genuine superstar before departing in the summer of 2014. Suárez’s attacking wizardry in 13/14 was remarkable and he served as a vital multiplier in the sides’ pinball style of play. Clearly he was a major loss but there were already reasons to suspect that some regression was due with or without him: Andrew Beasley wrote about the major and likely unsustainable role of set piece goals, while James Grayson and Colin Trainor highlighted the unusually favourable proportions of shots on target and blocked shots respectively during their title challenge. I wrote about how Liverpool’s penchant for early goals had led to an incredible amount of time spent winning over the season (a handy circumstance for a team so adept at counter-attacking), which may well have helped to explain some of their unusual numbers and that it was unlikely to be repeated.
These mitigating and potentially unsustainable factors notwithstanding, the dramatic fall in underlying performance, points (22 in all) and goals scored (an incredible 49 goal decline) is where Liverpool find themselves ahead of the coming season. Such a decline sees Brendan Rodgers go into this season under pressure to justify FSG’s backing of him over the summer, particularly with a fairly nightmarish run of away fixtures to start the season and the spectre of Jürgen Klopp on the horizon.
So, where do Liverpool need to improve this season?
Case for the defence
With the concession of six goals away at Stoke fresh in the memory, the narrative surrounding Liverpool’s defence is strong i.e. the defence is pretty horrible. Numbers paint a somewhat different story with Liverpool’s shots conceded (10.9 per game) standing as the joint-fifth lowest in the league last year according to statistics compiled by the Objective-Football website (rising to fourth lowest in open play). Shots on target were less good (3.8 per game and a rank of joint-seventh) although the margins are fairly small here. By Michael Caley’s and Paul Riley’s expected goal numbers, Liverpool ranked fourth and sixth respectively in expected goals against. Looking at how effective teams were at preventing their opponents from getting the ball into dangerous areas in open-play, my own numbers ranked Liverpool fifth best in the league.
It should be noted that analytics often has something of a blind spot when it comes to analysing defensive performances; metrics which typically work very well on the offensive side often work less well on the defensive side. Liverpool also tend to be a fairly dominant team and their opponents typically favour a deep defence and counter strategy against them, which will limit the number of chances they create.
One area where their numbers (courtesy of Objective-Football again) were noticeably poor was at set-pieces where they conceded on 11.6% of the shots by their opponents, which was 3rd worst in the league, compared to a league average conversion of 8.7%. Set-piece conversion rates are notoriously unsustainable year-on-year though, so some regression towards more normal conversion rates could potentially bring down Liverpool’s goal per game average compared to last season.
While Liverpool’s headline numbers were reasonable, their tendency to shoot themselves in the foot and concede some daft goals was impressive in its ineptitude at times. Culprits typically included combinations of Rodgers’ tactics, Dejan Lovren’s ‘whack a mole’ approach to defending and the embers of Steven Gerrard’s Liverpool career. The defensive structure of the team should be improved now that Gerrard no longer needs to be accommodated at the heart of midfield, while Glen Johnson’s prolonged audition for an extra role in the Walking Dead will continue at Stoke. Nathaniel Clyne should be a significant upgrade at full back, with youngsters Ilori and Gomez presently with the squad and aiming to compete for a first team role.
Broadly speaking though, Liverpool’s defensive numbers were reasonable but with room for improvement. Their numbers looked ok for a Champions League hopeful rather than a title challenger. A more mobile midfield should enhance the protection afforded to the central defence, however it should line up. Whether the individual errors were a bug and not a feature of this Liverpool team will likely determine how the narrative around the defence continues this year.
Under-powered attack
Liverpool’s decline in underlying performance in 2014/15 was driven by a significant drop-off in their attacking numbers. The loss of Suárez was compounded by Daniel Sturridge playing just 750 minutes in the league all season; Sturridge isn’t at the same level as Suárez (few are) but he does represent a truly elite forward and the alternatives at the club weren’t able to replace him.
The loss of Suárez and Sturridge meant that Coutinho and Sterling were now the principal conduits for Liverpool’s attack. Both performed admirably and were among the most dangerous attackers in the division. The figure below details Liverpool’s players according to the number of dangerous passes per 90 minutes played, which is related to my pass-danger rating score. In terms of volume, Coutinho and Sterling were way ahead of their teammates and both ranked in the top 15 in the league (minimum of 900 minutes played). James Milner actually ranked seventh by this metric, so he could well provide an additional source of creativity and link well with Liverpool’s forward players.
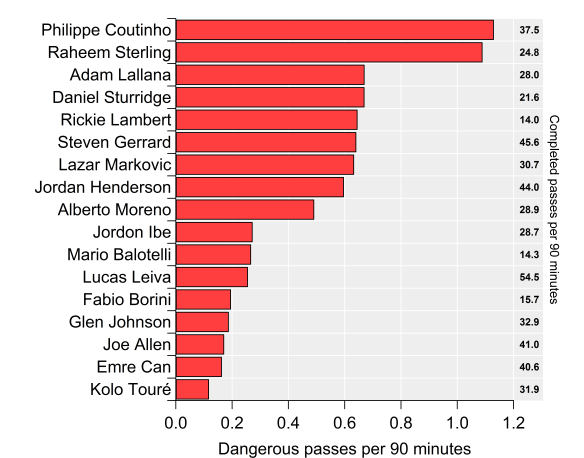
Dangerous passes per 90 minutes played metric for Liverpool players in 2014/15. Right hand side shows total number of completed passes per 90 minutes.
As good as Coutinho and Sterling were from a creative perspective, they did lag behind the truly elite players in the league by these metrics. As with many of Liverpool’s better players, you’re often left with the caveat of stating how good they are for their age. That’s not a criticism of the players themselves, merely a recognition of their overall standing relative to their peers.
What didn’t help was the lack of attacking contribution from Liverpool’s peak-age attacking players; Lallana’s contribution was decidedly average, Sturridge is obviously capable of making a stellar contribution but injuries curtailed him, while Balotelli certainly provided a high shot volume powered by a predilection for shooting from range but a potential dose of bad luck meant his goal-scoring record was well below expectation.
While there were clearly good elements to Liverpool’s attack, they were often left shooting from long range. According to numbers published by Michael Caley, Liverpool took more shots from outside the box than any other team last year and had the fourth highest proportion of shots from outside the box (48%). Unsurprisingly, they had the third lowest proportion of shots from the central region inside the penalty area (34%), which is the so-called ‘danger zone’ where shots are converted at much greater rates than wide in the box and outside the area. With their shot volumes being pretty good last season (third highest total shots and fourth highest shots on target), shifting the needle towards better quality chances would certainly improve Liverpool’s prospects. The question is where will that quality come from?
Bobby & Ben
With Sturridge not due back until the autumn coupled with his prior injury record, Liverpool moved to sign Christian Benteke as a frontline striker with youngsters Ings and Origi brought in to fill out the forward ranks. Roberto Firmino was added before Sterling’s departure but the expectation is that he will line-up in a similar role as the dynamic attacking midfielder/forward.
Firmino brings some impressive statistical pedigree with him: elite dribbler, dangerous passer, a tidy shot profile for a non-striker and stand-out tackling numbers for his position. If he can replicate his Bundesliga form then he should be a more than adequate replacement for Sterling, while also having the scope to develop over coming seasons.
Benteke brings a good but not great goal-scoring record, with his record in open-play being particularly average. Although there have been question marks regarding his stylistic fit within the team, Liverpool have seemingly been pursuing a physical forward to presumably act as a ‘reference point’ in their tactical system over the past few years; Diego Costa was a target in 2013, while Wilfred Bony was linked in 2014. Benteke brings that to the table alongside a more diverse range of skills than he is given credit for having been seemingly cast as an immobile lump of a centre forward by some.
Whether he has the necessary quality to improve this Liverpool team is the more pertinent question. From open-play, Benteke averages 2.2 shots per 90 minutes and 0.34 goals per 90 minutes over the past three seasons, which is essentially the average rate for a forward in the top European leagues. For comparison, Daniel Sturridge averages 4.0 shots per 90 minutes and 0.65 goals per 90 minutes over the same period. Granted, Sturridge has played for far greater attacking units than Aston Villa over that period but based on some analysis of strikers moving clubs that I’ve done, there is little evidence that shot and goal rates rise when moving to a higher quality team. Benteke does provide a major threat from set-pieces, which has been a productive source of goals for him but I would prefer to view these as an added extra on top of genuine quality in open-play, rather than a fig leaf.
Benteke will need to increase his contribution significantly if he is to cover for Sturridge over the coming season, otherwise Liverpool may find themselves in the good but not great attacking category again.
Conclusion
So where does all of the above leave Liverpool going into the season? Most of the underlying numbers for last season suggested that Chelsea, Manchester City and Arsenal were well ahead of the pack and I don’t see much prospect of one of them dropping out of the top four. Manchester United, Liverpool and Southampton made up the trailing group, with these three plus perhaps Tottenham in a battle to be the ‘best of the rest’ or ‘least crap’ and claim the coveted fourth place trophy.
When framed this way, Liverpool’s prospects look more viable, although fourth place looks like the ceiling at present unless the club procure some adamantium to alleviate Sturridge’s injury woes. While Liverpool currently operate outside the financial Goldilocks zone usually associated with a title challenge, they should have the quality to mount a concerted challenge for that Champions League spot in what could be a tight race. They did put together some impressive numbers during the 3-4-3 phase of last season that was in-line with those expected of a Champions League contender; replicating and sustaining that level of quality should be the aim for the team this coming season.
Prediction: 4-6th, most likely 5th.
P.S. Can Liverpool to be more fun this year? If you can’t be great, at least be fun.